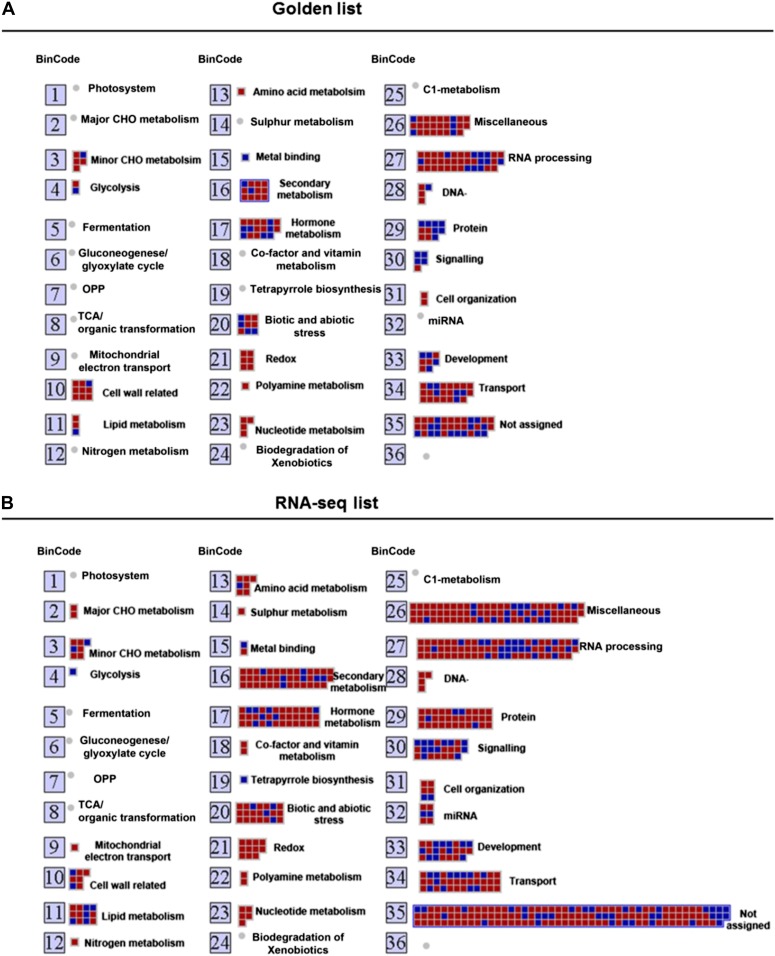
Figure 7.
Functional analysis of cytokinin-regulated genes by MapMan. Overview of the distribution of genes in different functional groups as identified by MapMan analysis from the golden list (A) and RNA-seq (B). Gray/red boxes correspond to up-regulated genes and black/blue boxes to down-regulated genes. The numbers refer to the bin designations as defined in MapMan. [See online article for color version of this figure.]

