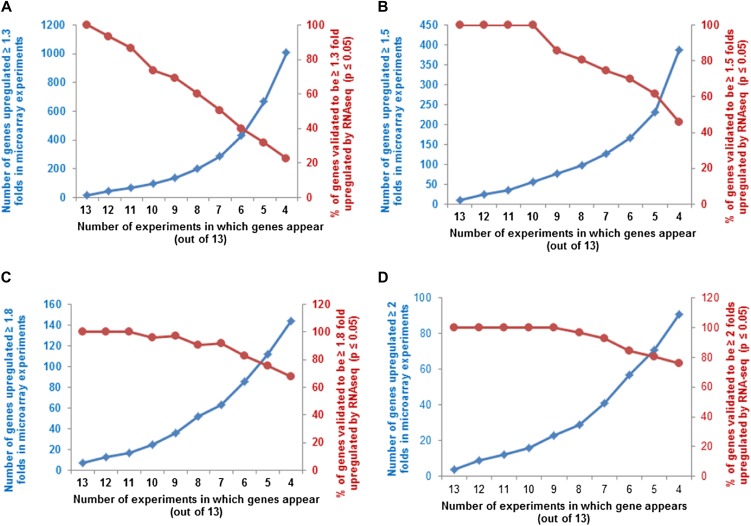
Figure 8.
Percentage of genes present in multiple microarrays validated by RNA-seq at different fold change cutoffs. A to D, The number of genes that are up-regulated at least 1.3-fold (A), 1.5-fold (B), 1.8-fold (C), or 2-fold (D), in at least the number of microarray experiments noted on the x axis (squares, left y axis), plotted along with the percentage of those genes thus identified that test as cytokinin regulated from the RNA-seq analysis using P ≤ 0.05 (circles, right y axis). [See online article for color version of this figure.]

