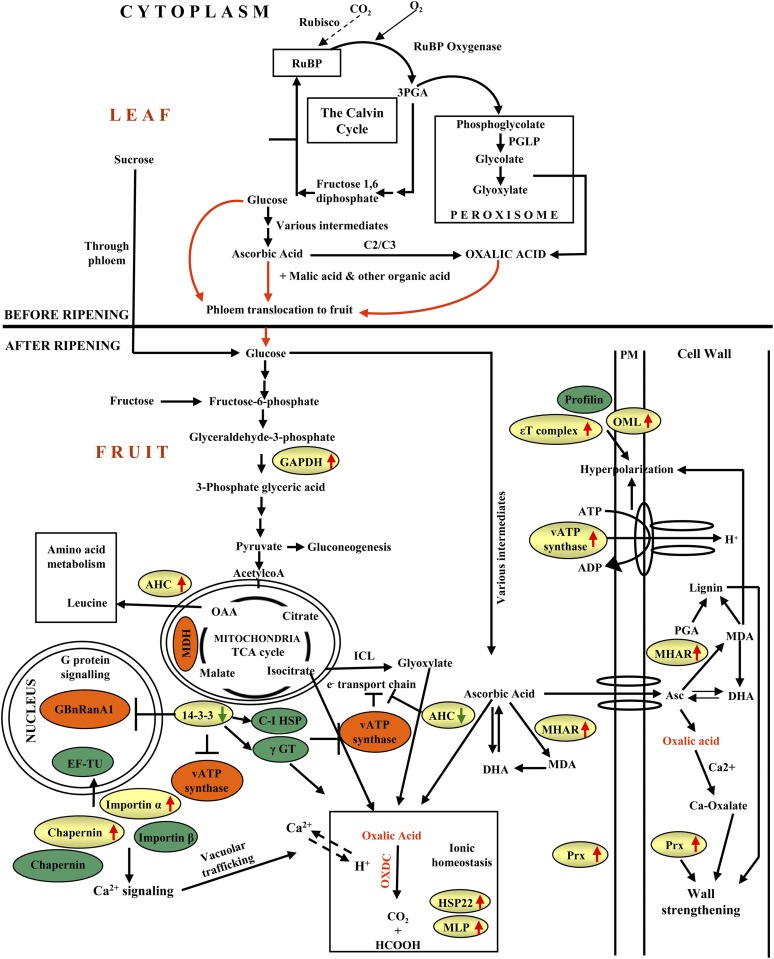
Figure 8.
A model summarizing the cellular pathways associated with OXDC overexpression. Green circles represent proteins exclusively detected from E8.2-OXDC extracts and orange circles indicate proteins apparently absent in E8.2-OXDC, while differentially expressed proteins in E8.2-OXDC fruit identified in this study are shown in the yellow-colored boxes. Red arrows indicate up-regulation, while green arrows represent down-regulation. GAPDH, Glyceraldehyde-3-P dehydrogenase; MDH, malate dehydrogenase; Asc, ascorbic acid; MHAR, monodehydroascorbate reductase; DHA, dehydroascorbic acid; MDA, monodehydroascorbic acid; PM, plasma membrane; OML, outer membrane lipoprotein; MLP, major latex protein; AHC, adenosylhomocysteinase; γGT, γ-glutamyl transferase-like protein; Prx, peroxiredoxin; C-I HSP, class I heat shock protein; GBnRanA1, GTP-binding nuclear protein Ran-A1; PGA, polygalacturonic acid.

