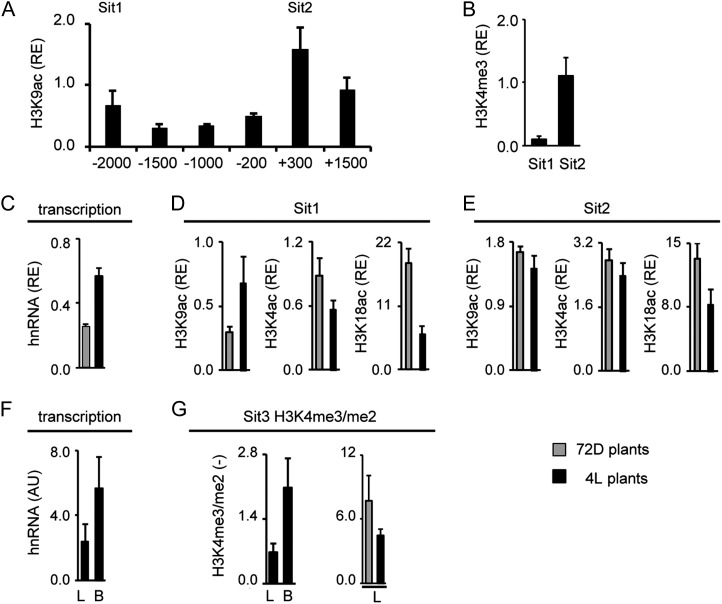
Figure 7.
Histone modification profile of the C4-Me gene from S. italica. A and B, Amount of chromatin precipitated with an antibody specific for H3K9ac and H3K4me3 in illuminated leaves (4L). Positions chosen for further analyses are designated Sit1 and Sit2. Values are presented as the relative enrichment (RE) of modifications per nucleosome over modifications per nucleosome found on S. italica Actin1. Numbers on the x axis indicate bp positions relative to TIS. C, Relative quantification of C4-Me hnRNA expression levels in S. italica leaves from plants that were exposed to 72 h of darkness (72D; gray columns) and in plants that were illuminated for 4 h (4L; black columns). Transcription is standardized for Actin1 expression (RE). hnRNA expression levels were determined by quantitative RT-PCR with a primer system specific for an intron (Supplemental Fig. S1). D and E, Light-dependent acetylation of H3K9ac, H4K5ac, and H3K18ac on positions Sit1 and Sit2. Values are presented as the relative enrichment of modifications per nucleosome over modifications per nucleosome found on S. italica Actin1. F, Quantification of C4-Me hnRNA expression levels in S. italica leaves (L) and B cells (B) isolated from plants that were illuminated for 4 h (4L plants). Values are arbitrary units (AU) derived from a cDNA standard dilution series. hnRNA expression levels were determined by quantitative RT-PCR with a primer system specific for an intron (Supplemental Fig. S1). G, Ratio of the amount of chromatin precipitated with an antibody specific for H3K4me3 and H3K4me2 in leaves and B cells. Black bars indicate data from illuminated plants (4L), whereas gray bars indicate data from plants that were exposed to 72 h of darkness (72D). Ratios are without dimension. All data points are based on at least three independent experiments. Vertical lines indicate se.

