Figure 2.
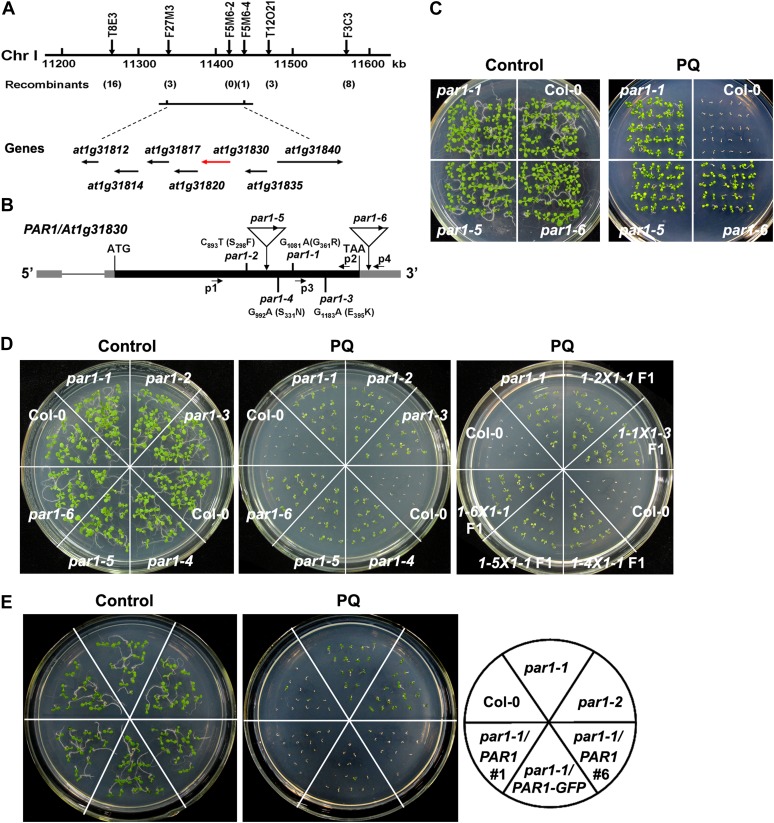
Map-based cloning of PAR1. A, Genetic mapping of PAR1. Markers used for the genetic mapping are shown on the top, and the number of recombinants for each marker is given below the map. Predicted genes are shown at bottom, and the arrows indicate the direction of transcription. The PAR1 candidate gene is shown in red. B, Genome structure of the PAR1 gene. The black boxes, gray boxes, and lines indicate exons, untranslated regions, and introns, respectively. The positions and the nature of the par1 mutant alleles are shown. The positions and orientations of PCR primers (for genotyping and RT-PCR analyses; P1–P4) are shown. C, Two-week-old seedlings of the wild type (Col-0) and par1 allelic mutants germinated and grown on MS medium in the presence or absence of 1 μm paraquat (PQ). D, Ten-day-old Col-0, par1, and F1 seedlings derived from the crosses between different combinations of par1 allelic mutants germinated and grown in the presence of 1 μm paraquat. E, Genetic complementation of the par1 mutant phenotype. Seven-day-old seedlings with the indicated genotypes were germinated and grown on MS medium in the presence or absence of paraquat. par1-1/PAR1 and par1-1/PAR1-GFP refer to par1-1 seedlings carrying a PAR1 and a PAR1-GFP transgene, respectively, under the control of the PAR1 promoter. [See online article for color version of this figure.]

