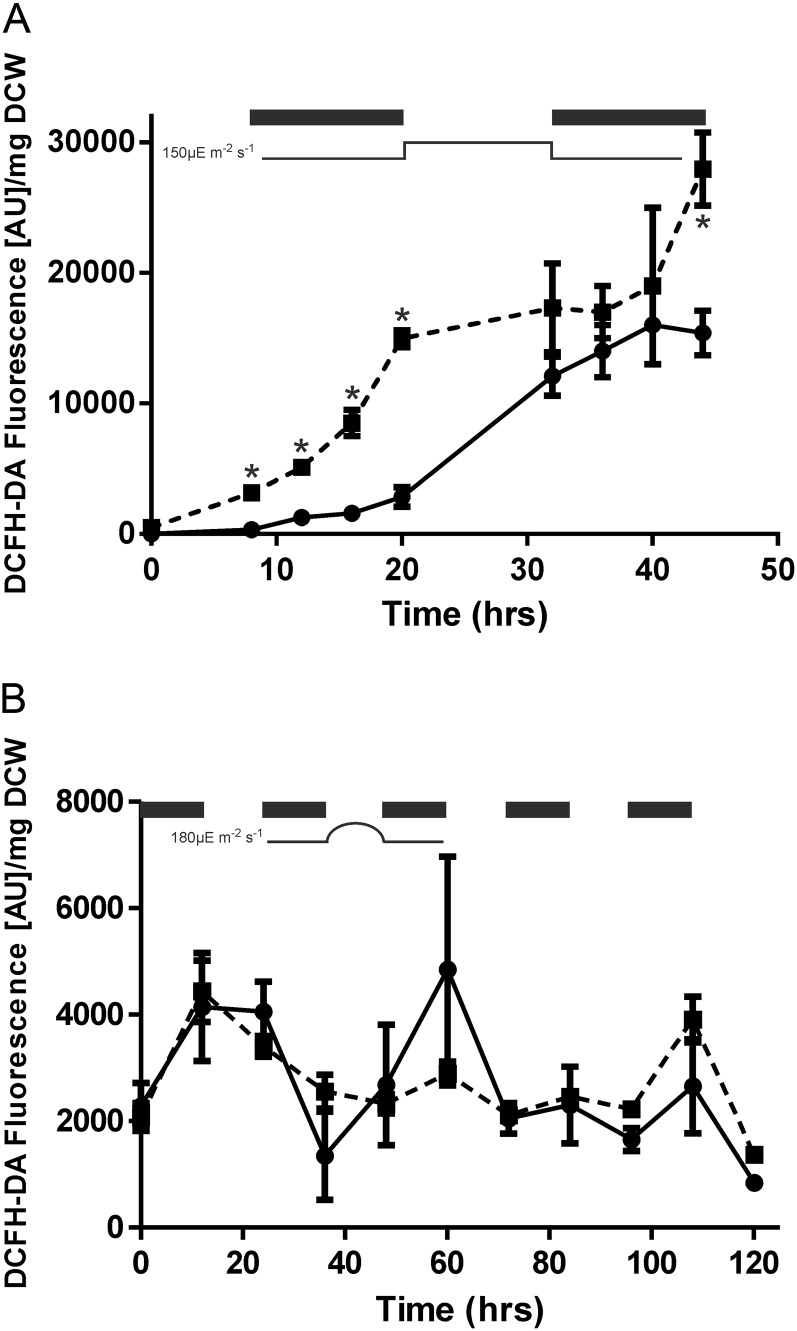
Figure 5.
DCF fluorescence of wild-type (solid line) and ΔCOX/Cyd (dashed line) samples cultured under 12-h high-light (150 µmol photons m−2 s−1)/dark square-wave cycles (A) and 12-h sinusoidal light (180 µmol photons m−2 s−1)/dark cycles (B). Asterisks indicate significant differences between samples (P < 0.05). Dark periods are indicated by black bars. Results are from three biological replicates. AU, Absorbance units.

