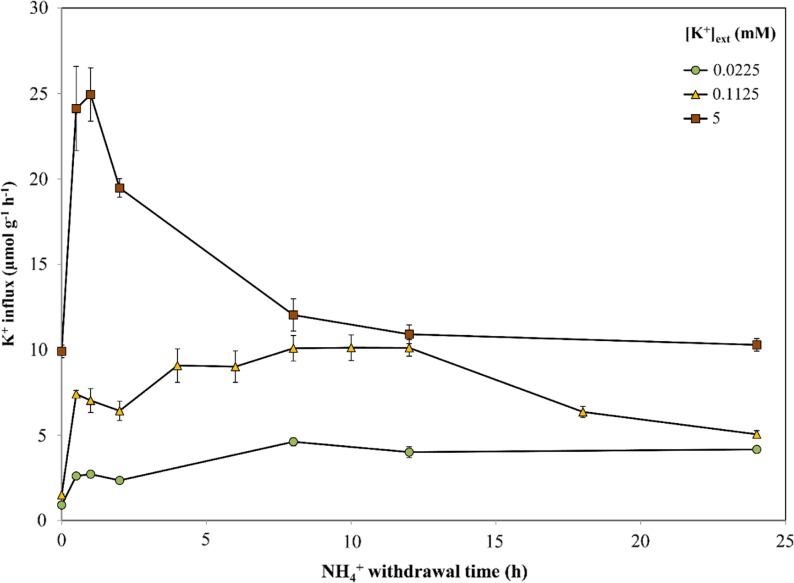
Figure 6.
Responses of K+ influx to the duration of NH4+ withdrawal in roots of intact barley seedlings grown under full nutrient medium, various [K+]ext levels, and 10 mm [NH4+]ext. Fluxes are indicated on a root fresh weight basis. Each data point represents the mean of four replicates. Error bars indicate se. [See online article for color version of this figure.]

