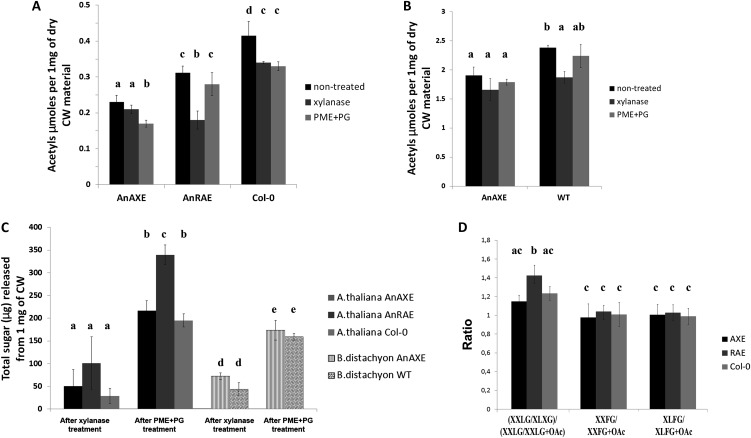
Figure 2.
A and B, Cell wall (CW) acetylation of transgenic Arabidopsis (A) and Brachypodium (B) lines and wild-type plants (WT). Shown mean values are averages for three independent transgenic lines for each construct and three wild-type plants grown simultaneously. Acetyl content is shown in µmol mg−1 dry cell wall material. Bars show means ± sd averaged for three independent transgenic lines. C, Amount of reducing sugars released after incubation of dry cell wall material from transgenic and wild-type control plants with xylanase and PME+PG during 24 h. D, Ratios of nonacetylated to acetylated xyloglucan oligosaccharides obtained after xyloglucan endoglucanase digestion of cell walls from Arabidopsis AnAXE, AnRAE, and wild-type plants analyzed by MALDI-TOF. Nomenclature of subunits is according to Fry et al. (1993). Data represent average values obtained for three independent transgenic lines. Letters (a–e) indicate significant differences among the combinations of genotypes and treatments (ANOVA, P ≤ 0.05).

