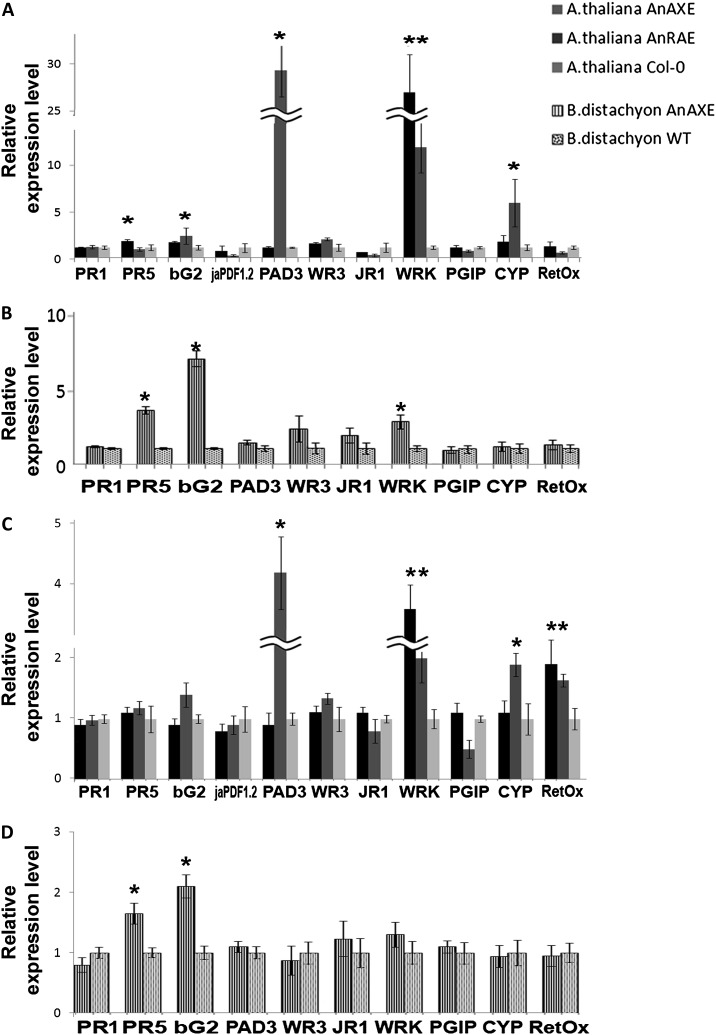
Figure 6.
Real-time RT-PCR analysis of selected pathogen-related genes in uninfected and infected transgenic lines and wild-type plants (WT). A and B, Expression levels of defense-related genes in Arabidopsis (A) and Brachypodium (B) transgenic plants. C and D, Gene expression in Arabidopsis (C) and Brachypodium (D) transgenic plants upon 48 h of infection with B. cinerea and B. sorokiniana, respectively. Gene expression levels in transgenic plants normalized to the expression of the same gene detected in wild-type plants (for which gene expression was set to 1), ACTIN2 (for Arabidopsis) or GADPH (for Brachypodium), were used as reference genes. The comparative threshold cycle method was used for determining differences between transcript copy numbers in wild-type and transgenic plants. Data represent average obtained for three independent transgenic lines. Asterisks indicate significant differences between transgenic plants and wild-type plants (Student’s t test, P < 0.05; n = 3).

