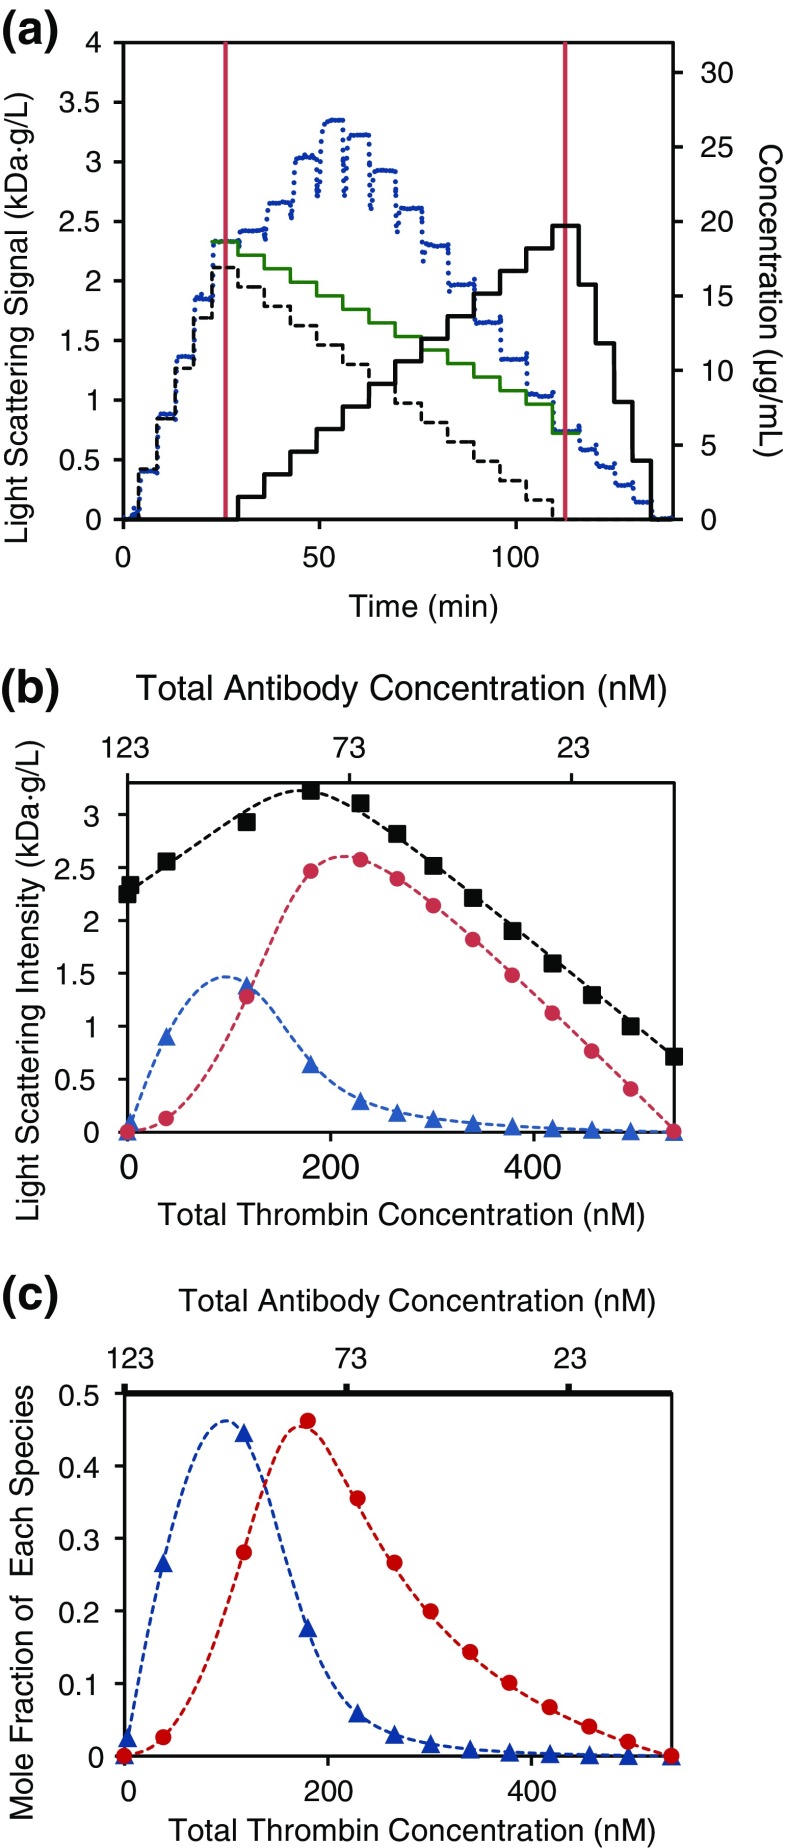
Fig. 4.
Typical antibody–antigen binding data. a Composition-gradient (CG)-MALS data based on the method of Fig. 1. Dotted blue line Measured LS data, dashed black line injected anti-thrombin immunoglobulin G (ATI) concentration, solid black line injected α-thrombin (THR) concentration, solid green line simulated no-interaction LS signal. b Hetero-association modeling. Black squares LS data points measured after equilibration, dashed black line best-fit model, 2(THR):1(ATI) with equivalent and independent binding sites, KD = 9 nM. Other plots represent LS contributions from the complexes. Blue triangles 1:1, red circles 2 (THR):1 (ATI). c Mole fraction of complexes, same symbols as for b. In b and c, plots for free monomers are not shown

