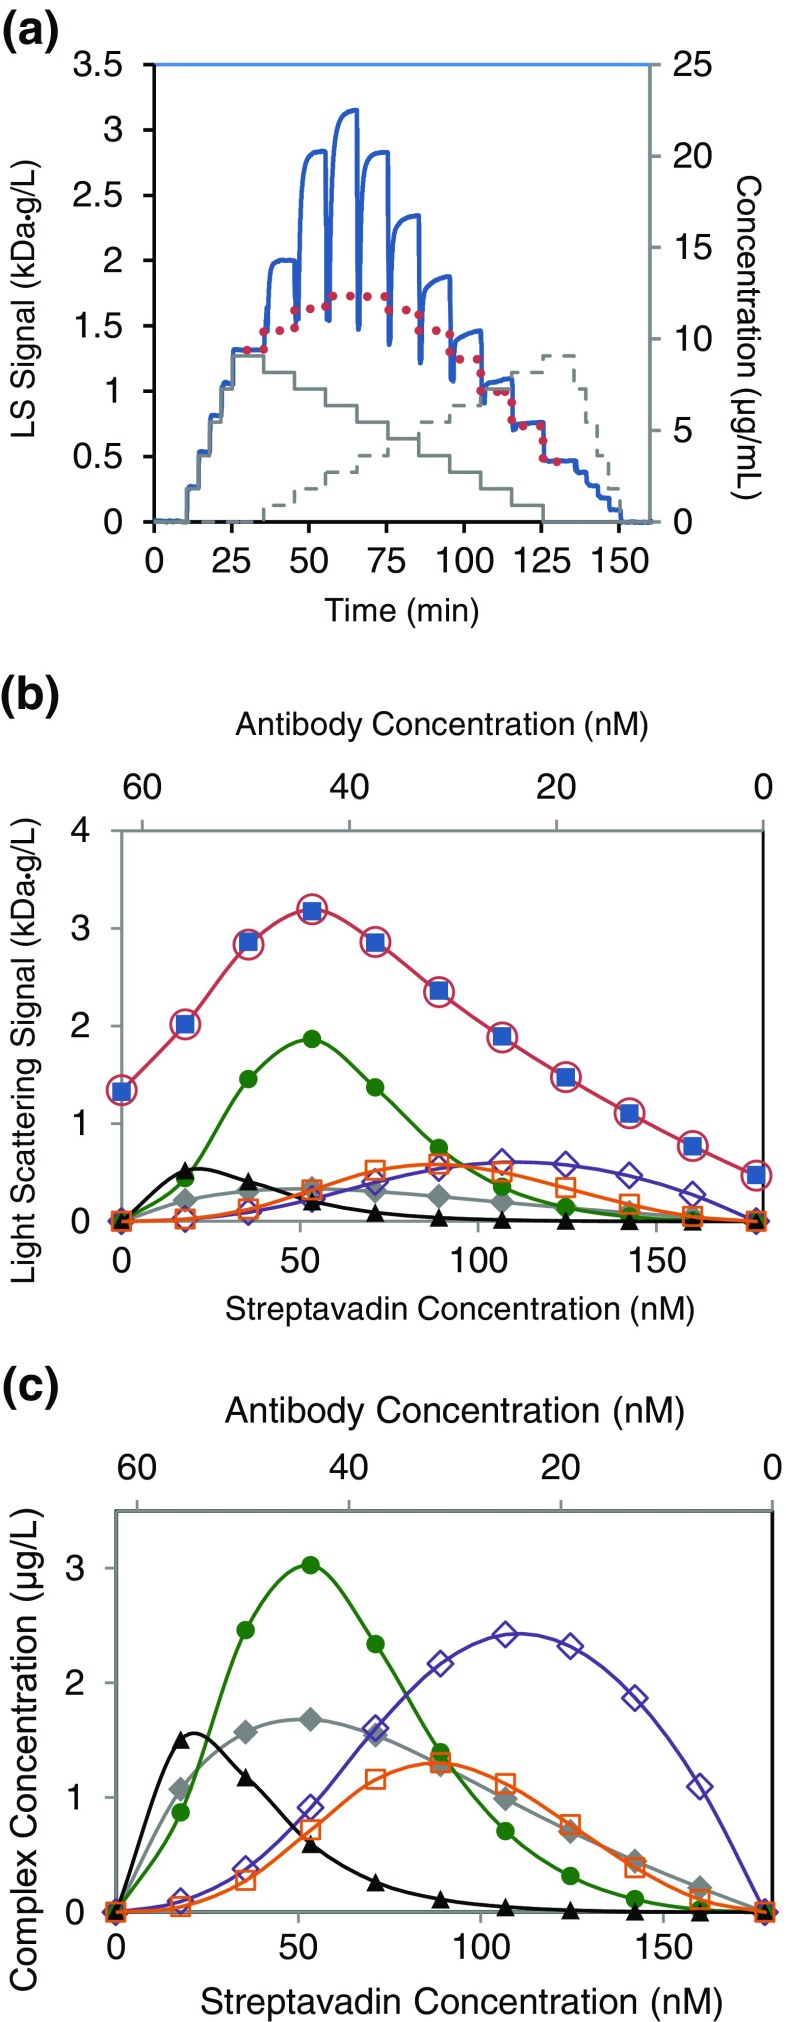
Fig. 8.
a CG-MALS gradient of multi-valent/multi-valent SA + immunoglobulin G interaction. Solid blue line MALS data, dotted red line simulated LS from 1:2 interaction, solid gray line injected SA concentration, dashed gray line injected antibody concentration. b Hetero-association fitting. Blue squares LS data from each injection measured at equilibrium, open red circles best fit to a model assuming the complexes of Fig. 7a, single-site KD = 20 nM, filled gray diamonds 1:1, filled green circles 2:2 + 3:3 + 4:4 + …, closed black triangles 1 SA:2 antibody, open purple diamonds 2 SA:1 antibody, open orange squares 3 SA:2 antibody. c Solution concentrations of the individual complexes, symbols as in b. Filled green circles represent total mass concentration of all n:n complexes excluding 1:1. In b and c free monomer plots not shown, lines are guides to the eye, and the self-interaction data are excluded as no self-association was evident

