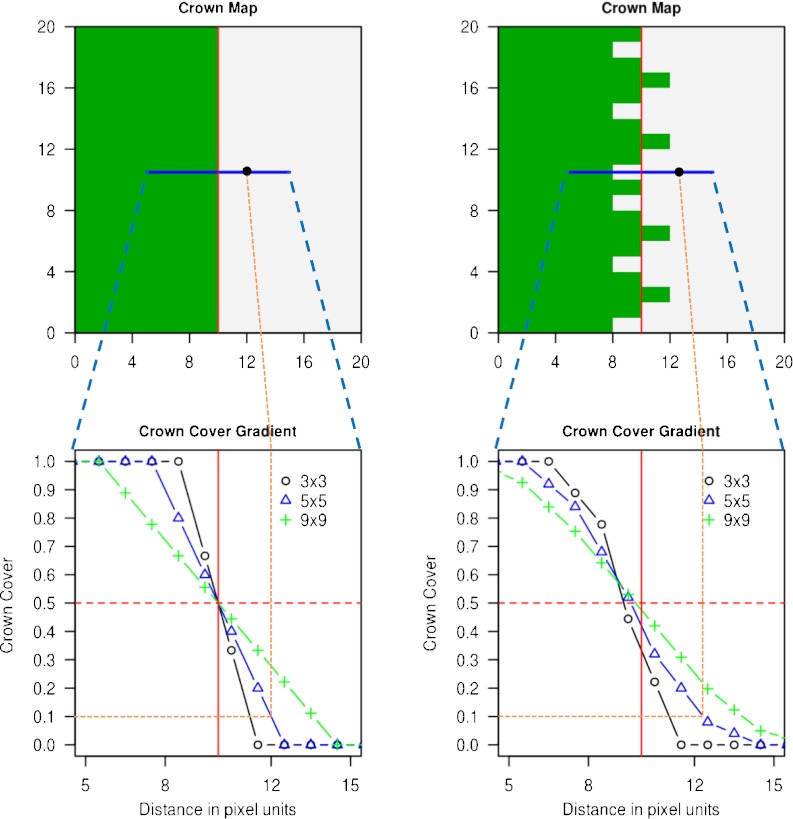
Fig. 3.
Schematic plot of a straight (left) and irregular (right) forest edges in a map (top) and crown cover gradient at the marked transects for three different square reference areas (bottom). The fine dotted lines give an example of how to read this graph: for a minimum crown cover of 0.1 and a reference area of 5×5 units, the vertical fine dotted line points to the locations in the above maps where the forest edge is located (i.e., the transition from forest to non-forest)

