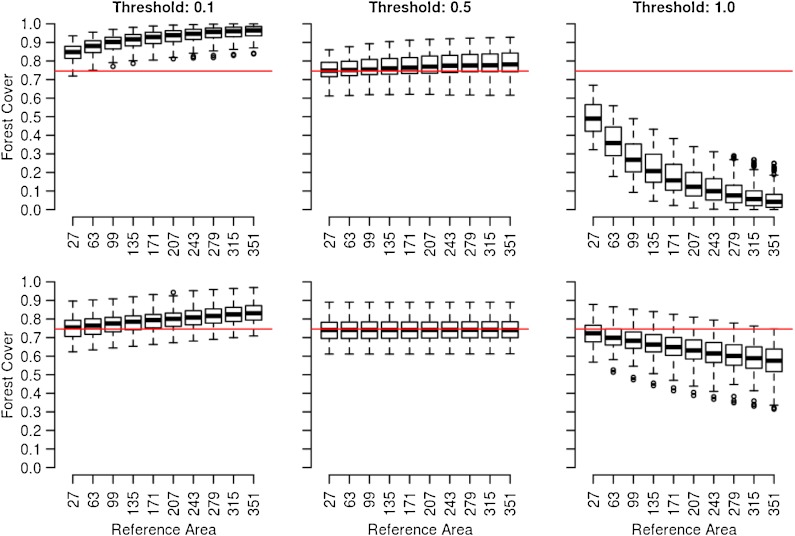
Fig. 5.
Box–whisker plots of forest cover for different reference areas and crown cover thresholds for a highly fragmented landscape (α = 0.7, top row) and a compact landscape (α = 1.4, bottom row). The horizontal line marks the average proportion of crown pixels in the crown maps. The box marks the upper and lower quartile with whiskers extending to the most extreme data points but no more than 1.5 times the interquartile range

