Figure 7.
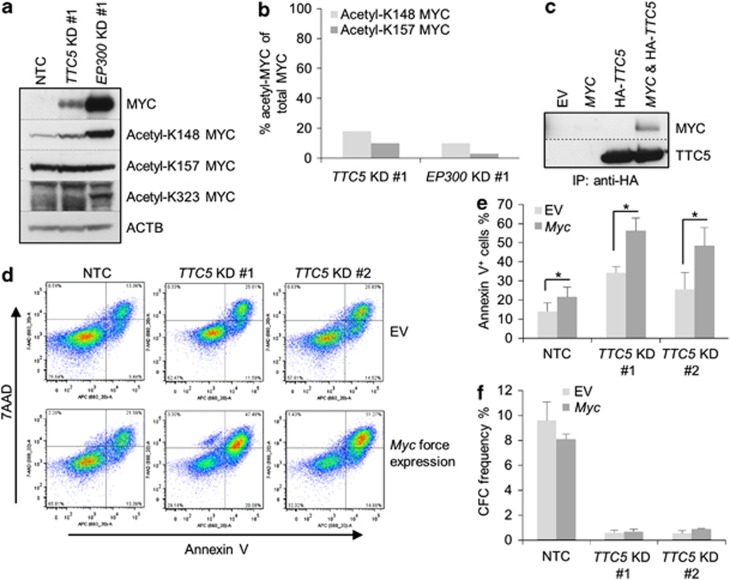
Myc accumulation and apoptosis after TTC5 or EP300 KD. THP1 cells were infected with lentiviruses expressing shRNAs targeting TTC5 or EP300 for KD, or a non-targeting control shRNA (NTC), with puromycin drug resistance as the selectable marker. (a) Representative western blots show expression of MYC, acetylated MYC and ACTB after EP300 or TTC5 KD, 72 h after lentiviral infection. (b) Bar chart shows semiquantitative analysis of acetyl-K148 MYC or acetyl-K157 MYC signal as a percentage of total MYC signal, as determined by ImageJ analysis of the bands shown in (a). (c) 293FT cells were transiently transfected with the indicated constructs. After 48 h, cells were harvested and lysates were immunoprecipitated with an HA-tag antibody. The immunoprecipitated complex was analyzed by western blotting using MYC or TTC5 antibodies. IP=immunoprecipitation. (d–f) Control and Myc-overexpressing THP1 cells were infected with lentiviruses expressing shRNAs targeting TTC5 for KD or a NTC shRNA, with puromycin drug resistance as the selectable marker. (d) Representative FACS plots show annexin V and 7-aminoactinomycin (7-AAD) binding to control and KD cells, 7 days after lentiviral infection. Bar charts show (e) mean±S.E.M. percentage of apoptotic cells, as determined by annexin V binding, 7 days after lentiviral infection (n=3); and (f) mean±S.E.M. colony-forming cell (CFC) frequencies of drug-resistant cells enumerated following 10 days in semisolid culture (n=3). EV=empty vector. * indicates P⩽0.05 (paired t-test) for comparison of KD versus control conditions

