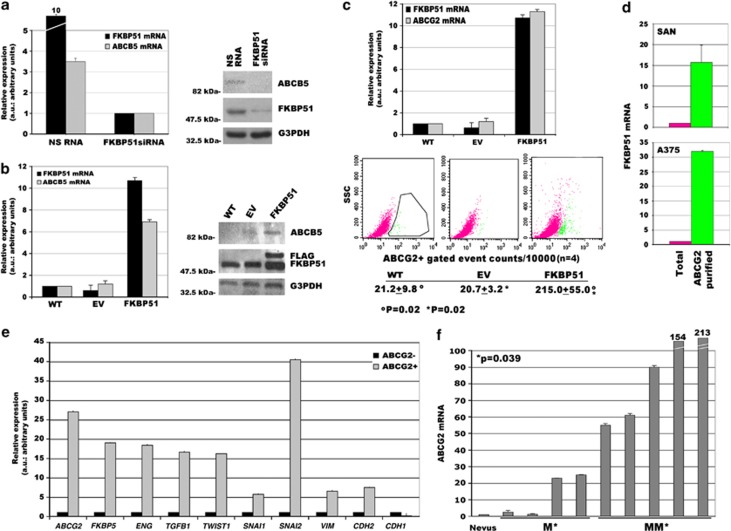
Figure 2.
FKBP51 increases expression of melanoma CSC markers. (a) FKBP51 silencing decreases ABCB5 levels. (Left) Normalized expression rates (arbitrary units (AU)) (mean±S.D.) of FKBP51 (black) and ABCB5 mRNA (grey) (n=3). FKBP51-treated sample expression=1. (Right) Western blot assay of ABCB5 and FKBP51 levels. (b) FKBP51 overexpression enhances ABCB5 levels. (Left) Normalized expression of FKBP51 mRNA (black) and ABCB5 mRNA (grey) measured in WT, EV-, or FKBP51-stably transfected melanoma cells. WT sample expression=1; n=3. (Left) Western blot assay of ABCB5 and FKBP51 levels in the same cells. Anti-Flag-labelled exogenous FKBP51. (c) ABCG2+ melanoma cells increase in FKBP51-overexpressing cells. (Upper) Normalized expression of FKBP51 mRNA (black) and ABCG2 mRNA (grey) measured in WT, EV-, or FKBP51-stably transfected melanoma cells. WT sample expression=1; n=5. (Lower) Flow cytometric histograms of ABCG2 expression (green population); mean±S.D. of counts are shown. (d) Enhanced FKBP51 mRNA levels in sorted ABCG2+ melanoma cells (SAN, upper; A375, lower). Whole cell expression=1; (n=3). (e) Enhanced EMT gene transcripts in sorted ABCG2+ melanoma cells. ABCG2− sample expression=1; n=3. (f) Expression of ABCG2 transcript in 9 deparaffinized tumours, 4 primary melanoma (M) samples, and 5 metastases (MM). A naevus sample was arbitrarily chosen with expression=1

