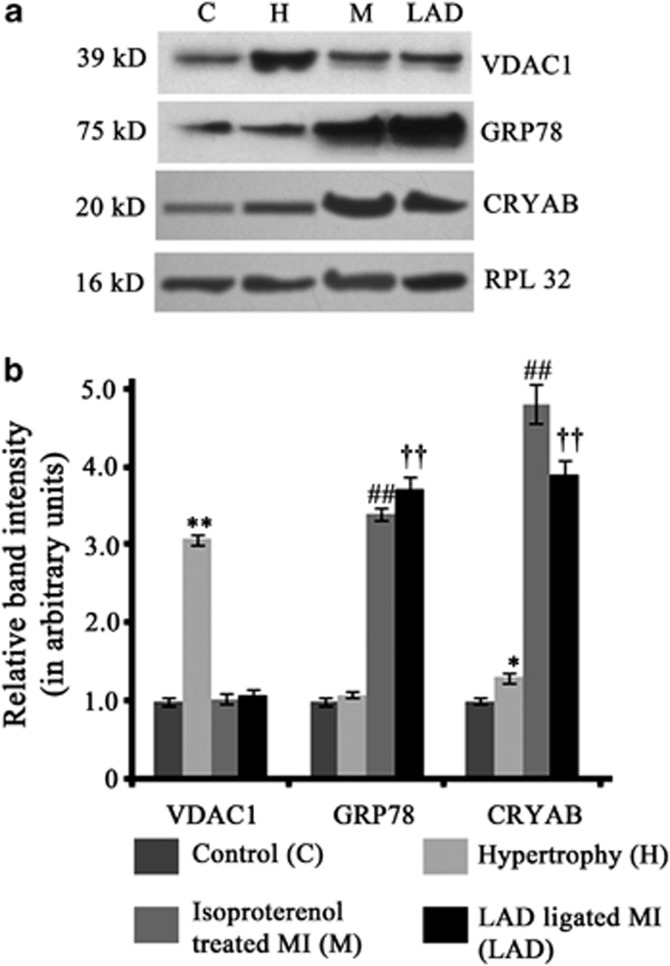
Figure 1.
(a) Western blot analyses showing change in the expression of VDAC1, GRP78 and CRYAB in control (C), hypertrophy (H), isoproterenol-treated MI (M) and LAD-ligated MI (LAD) in accordance with the proteomics data. (b) Graphs showing relative band intensity of (i) VDAC1, (ii) GRP78 and (iii) CRYAB, as revealed by western blot analyses. (**P<0.01 with respect to H versus C, H versus M and H versus LAD; ##P<0.01 with respect to M versus H and M versus C; ††P<0.01 with respect to LAD versus H and LAD versus C)

