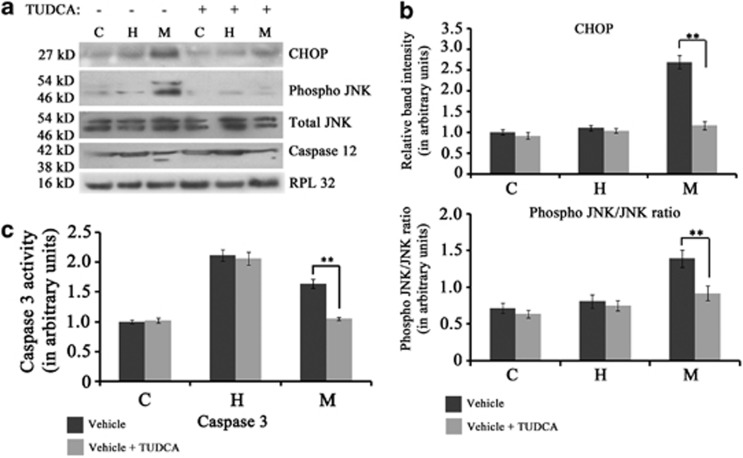
Figure 5.
(a) Immunoblot analyses showing significant decrease in the level of CHOP, ratio of phospho JNK to JNK and cleavage of caspase12 in rats treated with TUDCA during MI. (b) Graph showing relative band intensity of CHOP and phospho JNK in the three experimental groups viz., control (C), hypertrophy (H) and MI (M) treated with either TUDCA or vehicle alone. (c) Graph showing relative caspase 3 activity in C, H and M groups treated with either TUDCA or vehicle alone. Significant decrease in caspase 3 activity occurred in TUDCA-treated rats during M with no effect during hypertrophy. (**P<0.01)

