Figure 3.
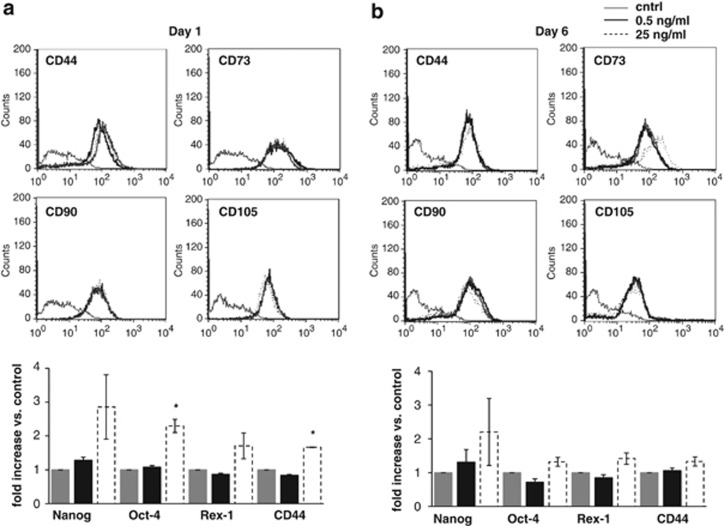
FasL did not modulate BM–MSC markers. BM–MSC were left untreated (cntrl) or treated with 0.5 ng/ml or 25 ng/ml FasL for 1 day (a) or 6 days (b). Cntrl BM–MSCs (gray line) or BM–MSCs treated with 0.5 ng/ml (black line) or 25 ng/ml FasL (dotted line) were stained with antibodies against CD105, CD73, CD44, and CD90 for cytofluorimetric analysis of membrane expression. Mean fluorescence was compared with FITC or PE isotypes (upper panels). N=3. Nanog, Oct-4, Rex-1, and CD44 mRNA expression were analyzed by qRT-PCR in untreated (control) BM–MSCs (gray bars) and in BM–MSCs treated with 0.5 ng/ml FasL (black bars), or 25 ng/ml FasL (hatched bars), and the level expressed as fold increase versus control (*P<0.05). N=3. Data are expressed as mean±S.E.

