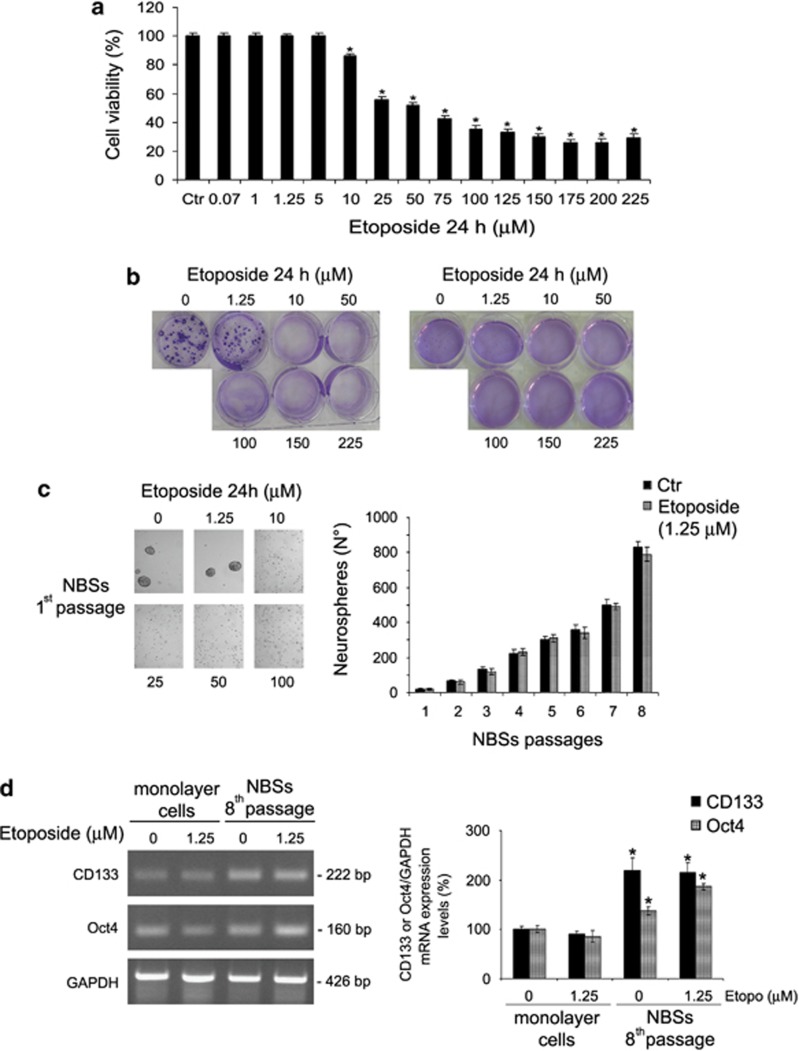
Figure 1.
Etoposide decreases cell viability and, at high drug concentrations, inhibits the tumorigenic potential of HTLA-230 NB cells and prevents NBS formation. (a) Cell viability was determined by MTT assays in cells exposed to increasing concentrations of etoposide (0.07–225 μM) for 24 h. Histograms summarize quantitative data of means±S.D. of five independent experiments. *P<0.01 versus untreated cells (Ctr). (b) Left panel, clonogenic assay. HTLA-230 cells were seeded in six-well plates and then incubated with 1.25, 10, 50, 100, 150 and 225 μM etoposide, as indicated, for 24 h. Subsequently, cells were incubated in fresh medium without the drug for an additional 20 days before staining and counting the colonies. Right panel, soft-agar colony formation assay. HTLA-230 cells were treated with 1.25, 10, 50, 100, 150 and 225 μM etoposide, as indicated, for 24 h, washed and re-plated in agar-containing medium. After 25 days, colonies were stained and counted. (c) Left panel, NBS formation. After treatment with etoposide (1.25–100 μM), HTLA-230 cells were cultured in serum-free culture conditions containing bFGF and EGF for 1 week (first passage). Original magnification × 10. Right panel, graph. At every passage (one per week), the NBSs in untreated (Ctr) and in 1.25 μM etoposide-treated cells were counted by analysis under an inverted microscope. The histogram summarizes quantitative data of means±S.D. of five independent experiments. (d) RT-PCR analyses of CD133 and Oct4 in untreated and etoposide-treated monolayer cells and in NBSs originating from by the same monolayer cells. The glyceraldehyde 3-phosphate dehydrogenase (GAPDH) signal is the internal loading control. Results are representative of three independent experiments with essentially similar results. Histogram, reported in the right panel, summarizes quantitative data of means, normalized to GAPDH expression±S.D. of three independent experiments. *P<0.01 versus monolayer cells

