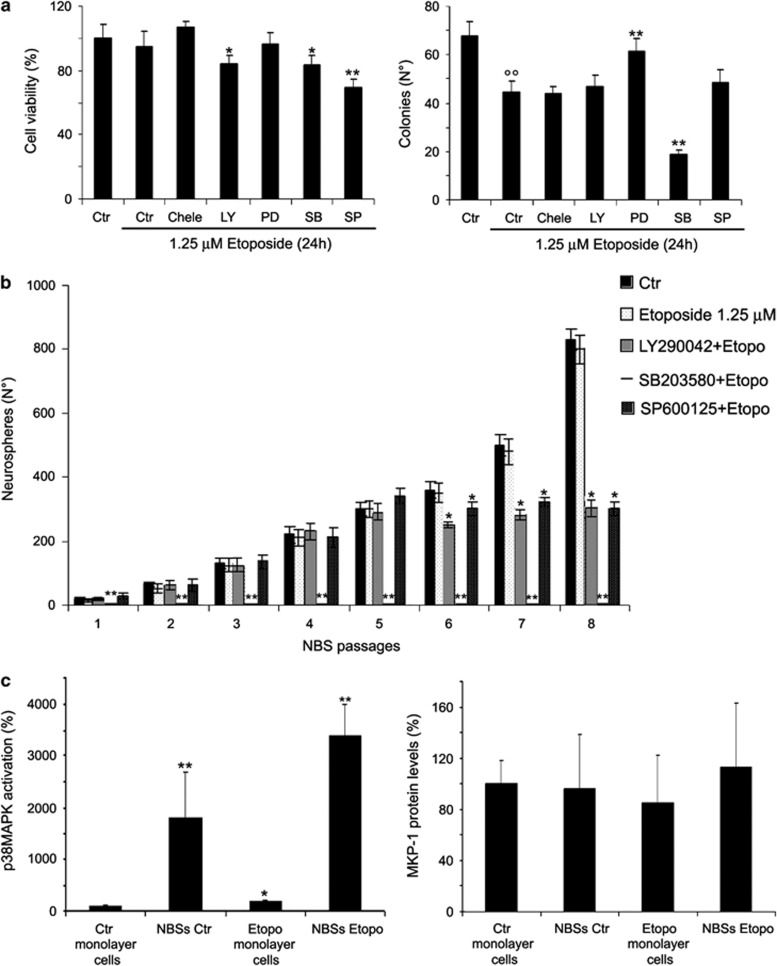
Figure 3.
Effects of SB203580 (SB) cotreatment on cell viability, clonogenicity and formation of NBSs. (a) Left panel, cell viability. Cells were pre-treated for 1 h with the different inhibitors (0.1 μM chelerythrine chloride (Chele), 500 nM LY2940042 (LY), 50 μM PD98059 (PD), 10 μM SB203580 or 4 μM SP600125 (SP)) and then exposed to 1.25 μM etoposide for an additional 24 h. Histogram summarizes quantitative data of means±S.D. of five independent experiments. *P<0.05 versus etoposide-treated cells and **P<0.01 versus etoposide-treated cells. Right panel, clonogenic assay. Histogram summarizes quantitative data of means±S.D. of five independent experiments. °°P<0.01 versus untreated (Ctr) cells and **P<0.01 versus etoposide-treated cells. (b) Growth curve of NBSs. At every passage (one per week), the NBSs originating from etoposide and inhibitor pre-treated cells were counted by analysis under an inverted microscope. Histogram summarizes quantitative data of means±S.D. of three independent experiments. *P<0.05 and **P<0.01 versus etoposide-treated cells. (c) Left panel, p38MAPK activation in untreated monolayer cells and in NBSs. Histogram summarizes quantitative data of means±S.D. of three independent experiments. *P<0.05 versus untreated monolayer cells and **P<0.01 versus monolayer cells. The data are expressed as a ratio of the levels of phosphorylated proteins to unphosphorylated proteins, whose values have been previously normalized with the relative glyceraldehyde 3-phosphate dehydrogenase (GAPDH) levels. Right panel, immunoblot analysis of MKP-1 in untreated monolayer cells and in NBSs. Histogram summarizes quantitative data of means±S.D. of three independent experiments

