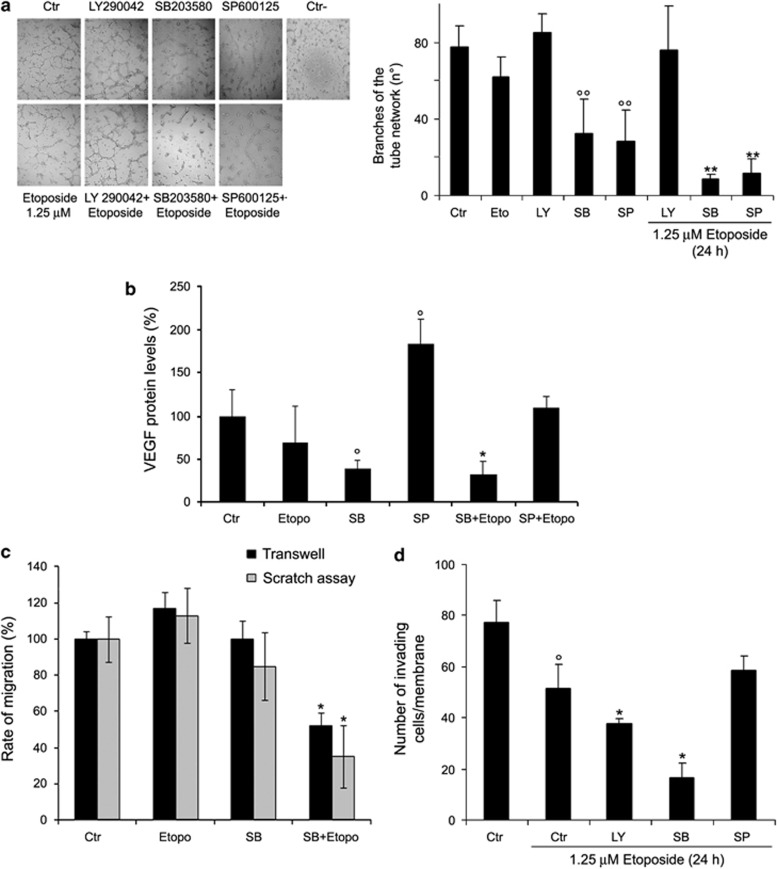
Figure 4.
SB203580 (SB) or SP600125 (SP) inhibit the formation of capillary-like structures and SB203580 cotreatment reduces migration and invasion of etoposide-treated cells. (a) Formation of capillary-like structures. Representative micrographs of the complete network of tubes formed by untreated (Ctr), treated (with etoposide, LY2940042, SB203580 or SP600125 alone) and cotreated cells (etoposide plus inhibitors). The negative control is obtained by cell exposure to 10 μM sulforaphane. Original magnification × 10. The graph reports the number of branches of the tube network formed by cells under the treatment conditions as described above. Quantitative data are the means±S.D. of three independent experiments. °°P<0.01 versus untreated (Ctr) cells and **P<0.01 versus etoposide-treated cells. (b) Immunoblot analysis of VEGF. The histogram summarizes quantitative data of means±S.D. of three independent experiments °P<0.05 versus untreated (Ctr) cells and *P<0.05 versus etoposide-treated cells. The data are expressed as a ratio of VEGF to glyceraldehyde 3-phosphate dehydrogenase (GAPDH) amounts. (c) Migration assay. Cell migration was evaluated by the scratch and Transwell assays. In the scratch assay, the rate of migration was quantified by measuring the distance between the migrating cell boundaries. In the Transwell assay, migration was quantified by counting the number of cells, which moved to the underside of the membrane after 24 h of treatment. Histogram summarizes quantitative data of means±S.D. of three independent experiments. *P<0.01 versus etoposide-treated cells. (d) Invasion assay. Cell invasion was quantified by counting the number of cells, which moved to the underside of the coated membrane after 24 h of treatment. Histogram summarizes quantitative data of means±S.D. of six fields per membrane of three independent experiments. °P<0.01 versus untreated (Ctr) cells and *P<0.01 versus etoposide-treated cells

