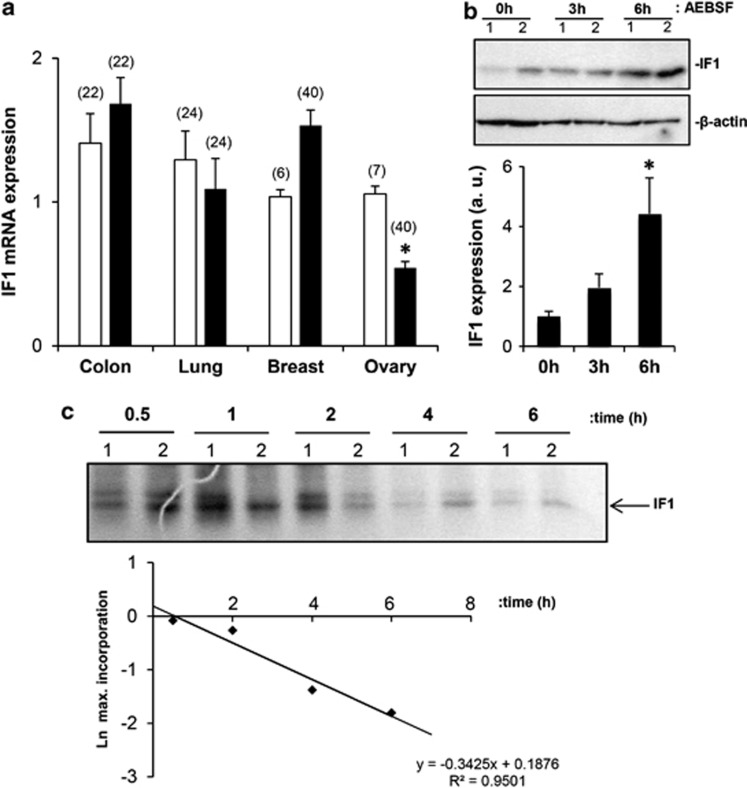
Figure 3.
IF1 expression is regulated at post-transcriptional levels. (a) The colon (HCRT103), lung (HLRT104), breast (BCRT101) and ovarian (HORT102) TissueScan Tissue quantitative PCR Arrays were used to determine the expression of IF1 mRNA in different normal (open bars) and tumor (closed bars) tissue specimens. The number of studied patients is indicated in brackets. The results shown are the mean±s.e.m. *P<0.001 when compared with normal by Student's t-test. (b) HCT116 cells were treated with 400 μℳ of the serine-proteases inhibitor 4-(2-aminoethyl) benzenosulfonyl fluoride hydrochloride for the indicated time and the expression of IF1 and β-actin (loading control) analyzed by western blot. Lanes 1 and 2, show different experiments of the same condition. Bars are the mean±s.e.m. of four experiments. *P<0.05 when compared with 0 h by Student's t-test. (c) After metabolic labeling with 35S-methionine IF1 was immunoprecipitated from HCT116 cells at the indicated time. Lanes 1 and 2, show different experiments of the same condition of the chase. The fluorogram reveals the migration of both the precursor and mature IF1 (arrow) 35S-labeled immunoprecipitated proteins. The plot shows the first order rate kinetics of the decay of IF1. The t1/2 for IF1 is in the 105–120 min range.

