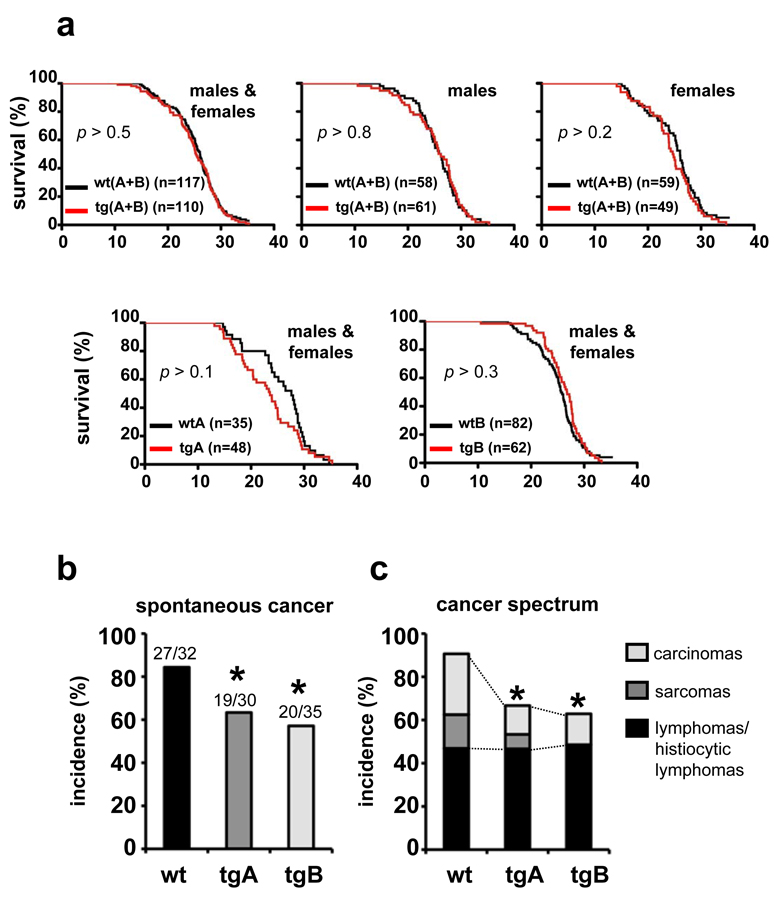
Figure 1. Normal lifespan but enhanced cancer protection in Sirt1-tg mice.
(a) Survival of cohorts of mice of the indicated genotypes. Logrank tests indicated that Sirt1-tg mice were not statistically different from wt mice (p > 0.05). (b) Spontaneous cancer incidence. Statistical significance vs wt mice was calculated using the Fisher’s Exact test : *p < 0.05. (c) Cancer spectrum. Statistical analysis refers to the combined incidence of carcinomas and sarcomas vs wt mice using the Fisher’s Exact test : *p < 0.05.

