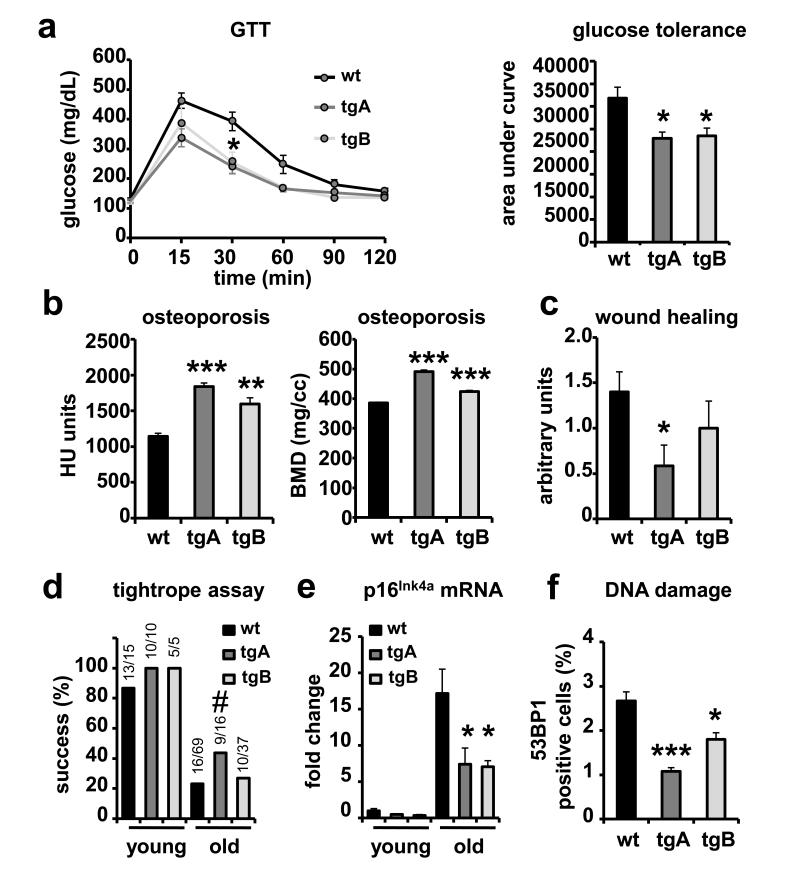
Figure 2. Improved healthy aging in Sirt1-tg mice.
(a) Glucose tolerance test in 1.5 years old male mice (n ≥ 4 per group). Curves are shown to the left. Integrated AUCs (area under curve) are shown to the right. (b) Osteoporosis was analyzed in 2.5 years old male mice (n = 3 per group) by microcomputed tomography (microCT). Values of Hounsfield units (HU) and bone mineral density (BMD) for the entire femurs are shown. (c) Wound-healing assay in ≥ 2 years old mice (n ≥ 10 per group). (d) Neuromuscular coordination assay. Young (< 6 months) and old (> 2 years) mice were subjected to the tightrope assay. (e) Levels of p16Ink4a mRNA in livers of young (< 6 months) and old (≥ 2 years) mice (n ≥ 3 per group) were analyzed by qRT-PCR. Data are relative to the levels in young wt mice. (f) Levels of DNA damage in the liver of old (≥ 2 years) mice (n ≥ 3 per genotype) measured as the percentage of 53BP1-foci positive nuclei by confocal microscopy. In all graphs except panel (d), values are given as average ± SEM, and statistical analyses are relative to wt controls and determined by the two-tailed Student’s t-test: *p < 0.05; **p < 0.01; ***p < 0.005. For panel (d), statistical significance was calculated using the Fisher’s Exact test: #p < 0.1.

