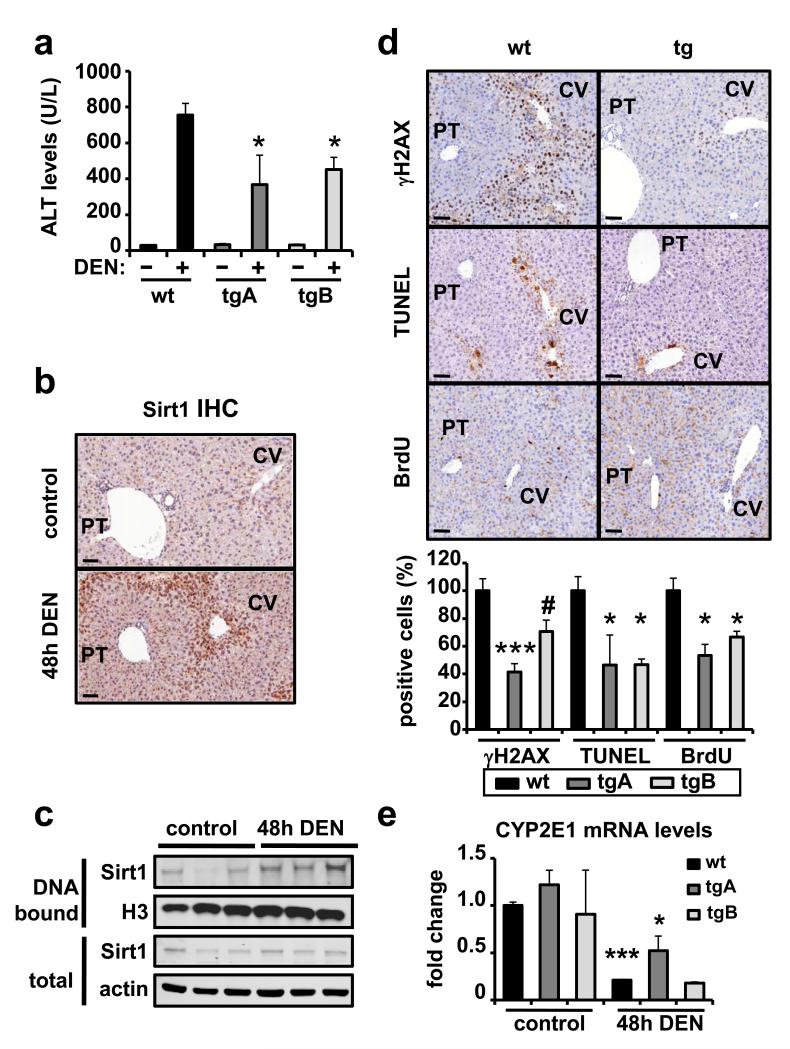
Figure 4. Sirt1 protects from DNA damage in the liver.
(a) Alanine transaminase (ALT) levels in serum before or 48 hours after DEN injection (n ≥ 3 per group). (b) Liver sections stained for Sirt1 before or 48 hours after DEN injection in wt mice. The bar indicates 50 μm. (c) Liver protein levels of Sirt1 bound to chromatin or in total extracts from wt mice (n=3) before or 48 hours after DEN injection. Histone H3 and actin were used as loading controls. (d) Representative stainings of DNA damage (γH2AX), apoptosis (TUNEL), and compensatory proliferation (BrdU), each showing a centrolobular area (around a centrolobular vein marked as CV) and a portal area (around a portal triad marked as PT) of livers of mice 48 hours after DEN injection. Bars indicate 50 μm. Quantifications are shown below relative to wt DEN-treated livers. For quantifications, at least 5 microscope fields at 20× magnification, always containing a CV and a PT were scored (n ≥ 3 per genotype). (e) Levels of CYP2E1 in the livers of control or DEN-treated mice (n ≥ 3 per group). Differences between tg samples and wt control were not significant (p > 0.1) in all cases. In all graphs, values are given as average ± SEM, statistical analyses are relative to wt controls and determined by the two-tailed Student’s t-test: #p < 0.1; *p < 0.05; ***p < 0.005.

