
Figure 4.
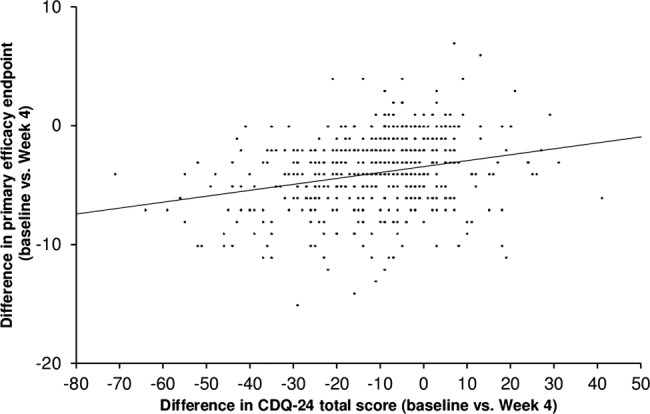
Correlation between change in Craniocervical Dystonia Questionnaire-24 total score and change in total Tsui score from baseline to week 4. Display of raw data; one dot may represent more than one patient. Correlation coefficient: 0.26, p<0.001, n=484 (week 12: correlation coefficient: 0.24, p<0.001, n=474).