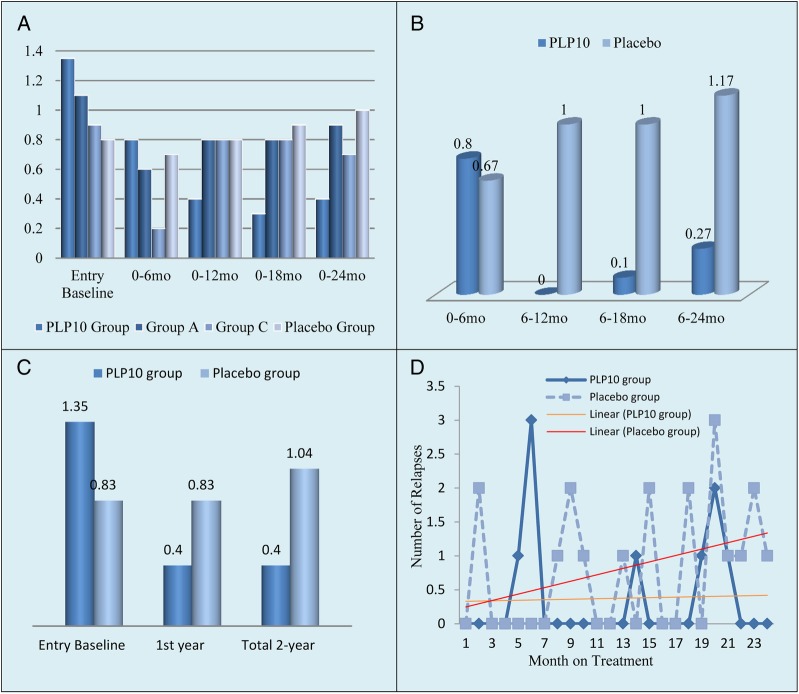
Figure 3.
(A) Demonstrates the ARR of the all-time on-study patients during the 24-month pretreatment (baseline ARR) and at different on-study intervals (6, 12, 18 and 24 months) per-treatment arm.* (B) Demonstrates the ARR of the all-time on-study population between the 0–6, 6–12, 6–18 and 6–24-month period intervals for the PLP10 versus placebo groups.* (C) Demonstrates the ARR of the all-time on-study population for the PLP10 versus placebo groups at baseline, during the first year, and during the second year on-treatment.* (D) Demonstrates the dispersion of relapses throughout the 2-year period of all-time on-study (excluding patients on natalizumab) for PLP10 (n=10) versus placebo (n=10). The placebo group showed an irregular dispersion of relapses compared with the PLP10 group, with a linear increasing trend, whereas the PLP10 group showed a stabilised linear trend. Using the per-protocol model in which the patients on natalizumab were excluded, the number of relapses could be compared on the same number of patients.* Including the patients on natalizumab.

