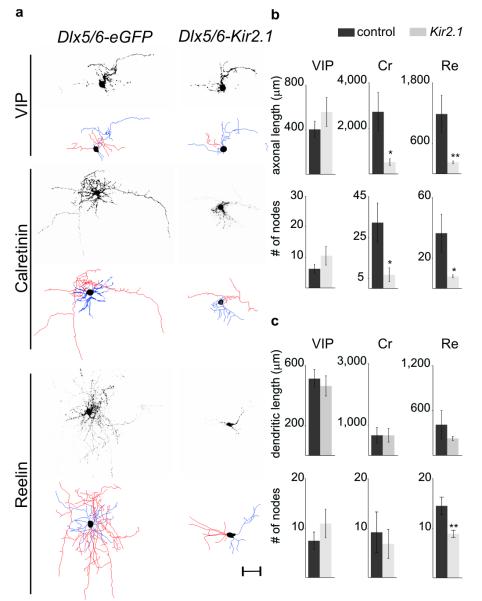
Figure 1. Defective morphology of Cr+ and Re+ interneuron subtypes resulting from Kir2.1 expression.
a. Representative examples of P8 VIP+, Cr+ and Re+ interneurons in mice electroporated at e15.5 with Dlx5/6-eGFP (control) or Dlx5/6-eGFP, Dlx5/6-Kir2.1 plasmids at e15.5. Photomicrographs of eGFP expression and corresponding neurolucida reconstructions depicting axons (red), dendrites (blue) and somata (black). Scale bar: 50 μm b. Morphometric analysis of control and Kir2.1-expressing VIP+, Cr+ and Re+ subtypes including the total length of axonal arbors (top) and number of axonal nodes (bottom). c. total length of dendritic trees (top) and number of dendritic nodes (bottom) in the same subtypes. Mean values (±SEM) were obtained from >4 reconstructed interneurons each in Dlx5/6-eGFP and Dlx5/6-eGFP, Dlx5/6-Kir2.1 electroporated mice. Paired t-test: *, P<0.05; **, P<0.01

