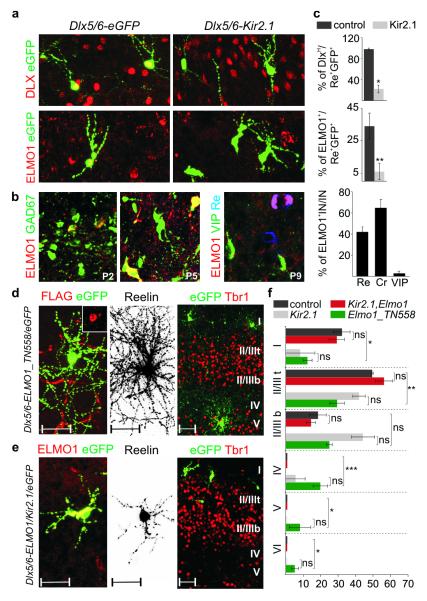
Figure 5. Activity-dependent expression of ELMO1 regulates CGE-derived interneuron migration.
a. Expression of Dlx genes and ELMO1 at P5 in Dlx5/6-eGFP and Dlx5/6-Kir2.1 electroporated interneurons at e15.5.
b. Expression of ELMO1 in GAD67-GFP transgenic mice at P2 and P5. Selective expression of ELMO1 in CGE-derived interneuron subtypes at P9. Quantification of ELMO1 expression in Re+, Cr+ and VIP+ interneurons (IN) at P9 (right). Mean percentage values (±SEM) were obtained from >70 interneurons for each subtype.
c. Quantification of DLXH and ELMO1 expression in Dlx5/6-eGFP (control) and Dlx5/6-Kir2.1 Re+ e15.5-electroporated interneurons at P5. Mean percentage values (±SEM) were obtained from >20 interneurons each in control and Kir2.1 electroporated mice for each quantification.
d. Electroporation of Dlx5/6-Elmo1_TN558.FLAG plasmid at e15.5. FLAG immunoreactivity is detected in electroporated interneurons at P9 (inset). Neuronal morphology of a Re+ interneuron and laminar distribution of electroporated interneurons at P9. Representative examples from 4 electroporated mice.
e. Co-electroporation of Dlx5/6-Elmo1 and Dlx5/6-Kir2.1 plasmids at e15.5. ELMO1 expression in electroporated interneurons at P9. Morphological defects of an electroporated Re+ interneuron and laminar distribution of electroporated interneurons. Representative examples from 6 electroporated mice.
f. Quantification of the distribution of Re+ interneurons across cortical layers at P9 upon expression of different plasmids. Mean percentage values (±SEM) were obtained from >80 interneurons for each group. Values for control and Dlx5/6-Kir2.1 alone groups are repeated from Figure 2 to facilitate comparison between groups. The large bracket indicates comparison between the control and Dlx5/6-Elmo1_TN558.FLAG electroporated internerneurons.
Paired t-test: *, P<0.05; **, P<0.01; ***, P<0.0001. DLXH, high level of DLX protein expression. Scale bars for d and e: 50 μm

