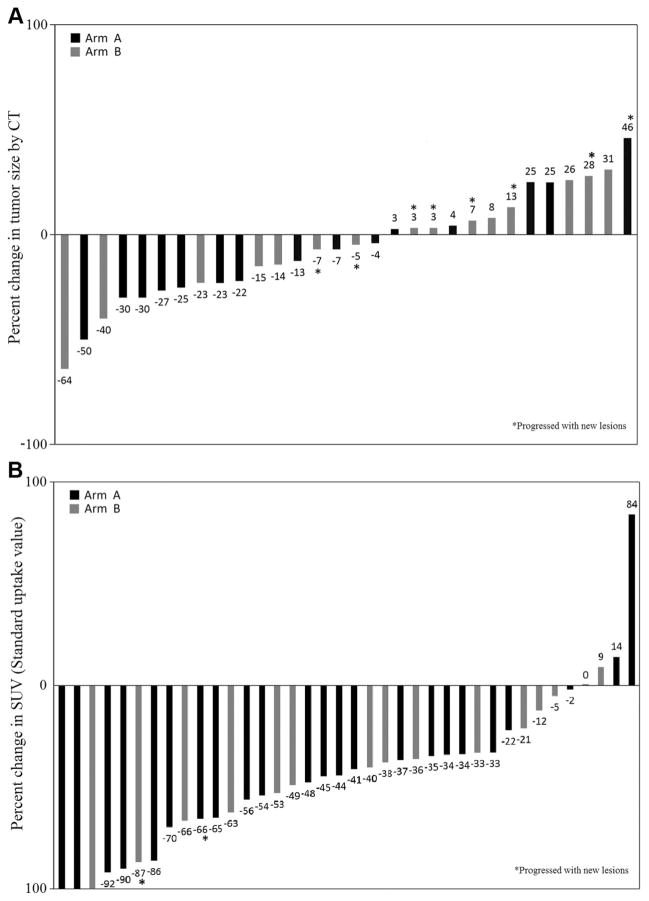
FIGURE 1.
A, Plot of percentage change in computed tomography (CT) tumor size by arm. Individual percentage change in tumor size by CT scan according to the treatment arm (n = 30). B, Plot of percentage change in standard uptake values (SUV) by arm. Individual percentage change in tumor SUV by positron emission tomography according to the treatment arm (n = 38). Two additional patients with progressive disease because of new metabolic lesions were not included.

