
FIGURE 2.
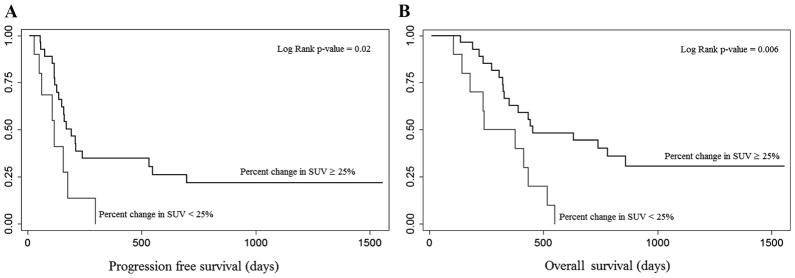
A, Kaplan-Meier plots of progression free survival by percentage change in standard uptake values (SUV). Kaplan-Meier plots showing progression-free survival according to percent decreases in SUV >25% and <25%. There is a statistically significant difference between patients with and without a metabolic response (P = 0.02). B, Kaplan-Meier plots of overall survival by percentage change in SUV. Kaplan-Meier plots showing overall survival according to percent decreases in SUV >25% and <25%. There is a statistically significant difference between patients with and without a metabolic response (P = 0.006).