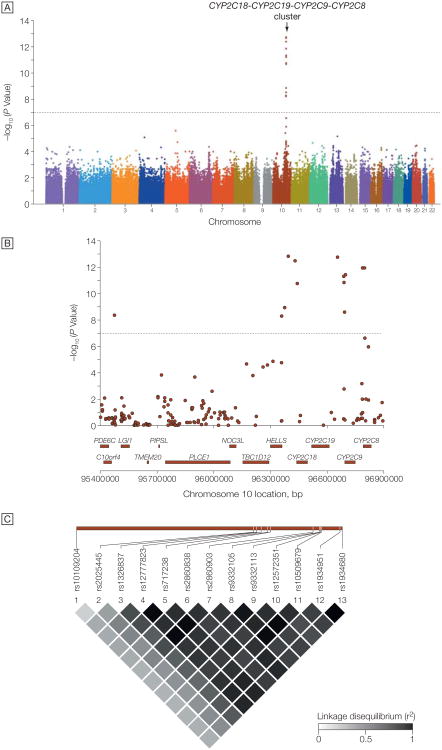
Figure 2. Genome-Wide Association Study of Adenosine Diphosphate–Stimulated Platelet Aggregation in Response to Clopidogrel.
A, Association (plotted as −log P value) of individual single-nucleotide polymorphisms distributed across the 22 autosomes. Horizontal dotted line indicates P=1.0 × 10⁻⁷. B, Enlargement of 1.5-megabase region on chromosome 10q24. Genes encoded in the region are shown below the plot. C, Linkage disequilibrium (r2) among the 13 single-nucleotide polymorphisms showing genome-wide significance with clopidogrel response. Increasing shades of gray represent increasing linkage disequilibrium, from white (r2=0) to black (r2=1).

