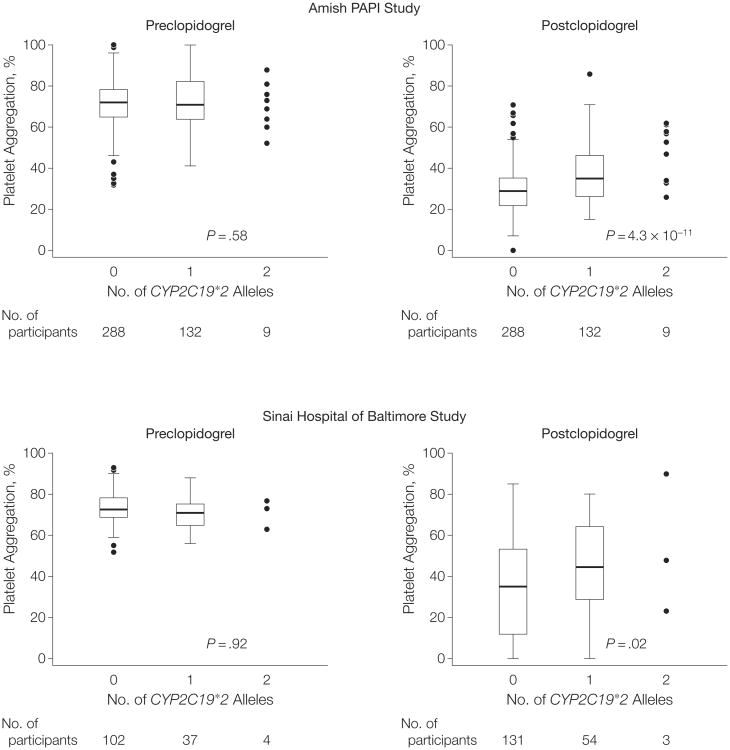
Figure 3.
Association of CYP2C19*2 (rs4244285) Loss-of-Function Variant With Adenosine Diphosphate–Stimulated Platelet Aggregation Before and After Clopidogrel Administration in Participants in the Amish Pharmacogenomics of Antiplatelet Intervention (PAPI) Study and Sinai Hospital of Baltimore Study
The horizontal line in the middle of each box indicates the median; the top and bottom borders of each box indicate the interquartile range (IQR). The whiskers above and below the box indicate plus/minus 1.5 IQRs, respectively; the points beyond the whiskers indicate outliers beyond 1.5 IQRs, except for those carrying 2 alleles in which all data points are plotted.

