
Figure 3.
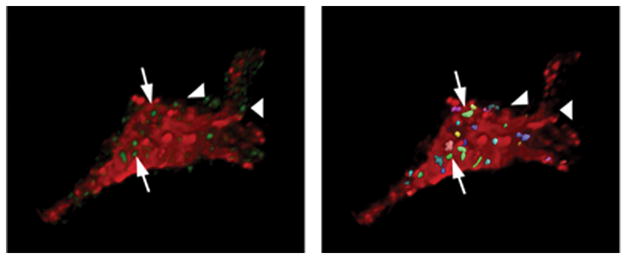
3-D Rendering of Confocal Images: CRH and VGLUT2. Left: cropped, 3-D rendering of a single CRH cell (red) amid green VGlut2 puncta, indicative of glutamatergic terminals. Right: processed image of the same cell, with multi-colored boutons indicating those showing significant overlap between red and green fluorescence signal. Arrows indicate examples of boutons that ‘contact’ the CRH neuron, as determined by the ‘overlap’ algorithm in Volocity 2; boutons that do not contact (arrowheads) do not register as overlapping entities. The volumes of positive elements in the cell and bouton channels were measured independently, using the classification features; overlap was determined using the co-localization feature, which determines incidence and volume of boutons contacting the immunolabeled cell. Preliminary analysis of ADX data using 6-cells/group (2 each from 3 animals/group) revealed a 56% increase in VGlut2 bouton counts/cell surface area using this method. In addition, ADX animals showed an increase in contact bouton overlap area and in overall bouton size.