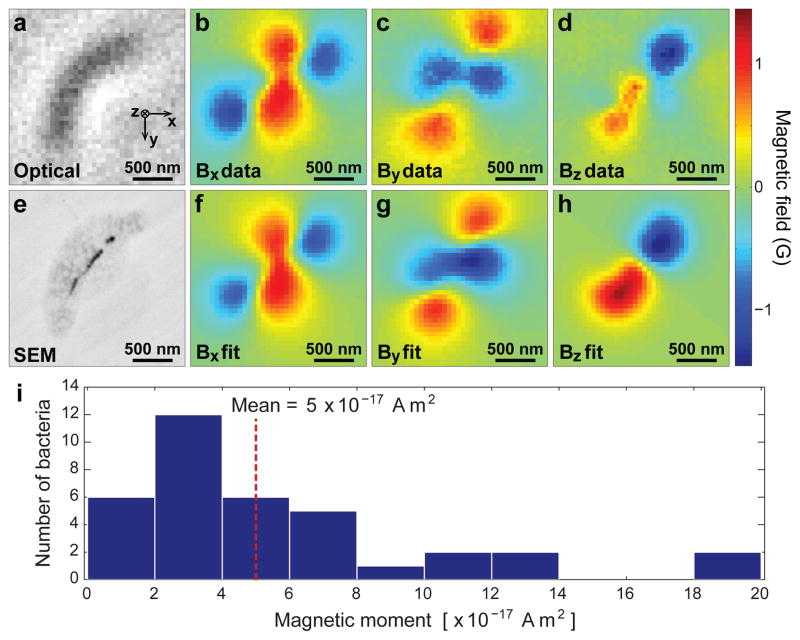
Figure 3. Determining magnetic moments of individual bacteria from measured magnetic field distributions.
a, Bright-field image of an MTB. b–d, Measured magnetic field projections along the x, y, and z axes within the same field-of-view. e, Scanning electron microscope (SEM) image of the same bacterium. f–h, Simulated magnetic field projections along the x, y, and z axes, assuming that magnetic nanoparticle locations match those extracted from e. The total magnetic moment was determined from the best fit of the calculated field distribution to the measurement (see Methods for details). i, Magnetic moments of 36 randomly-sampled MTB, as determined from optical magnetic field images and modelled field distributions.

