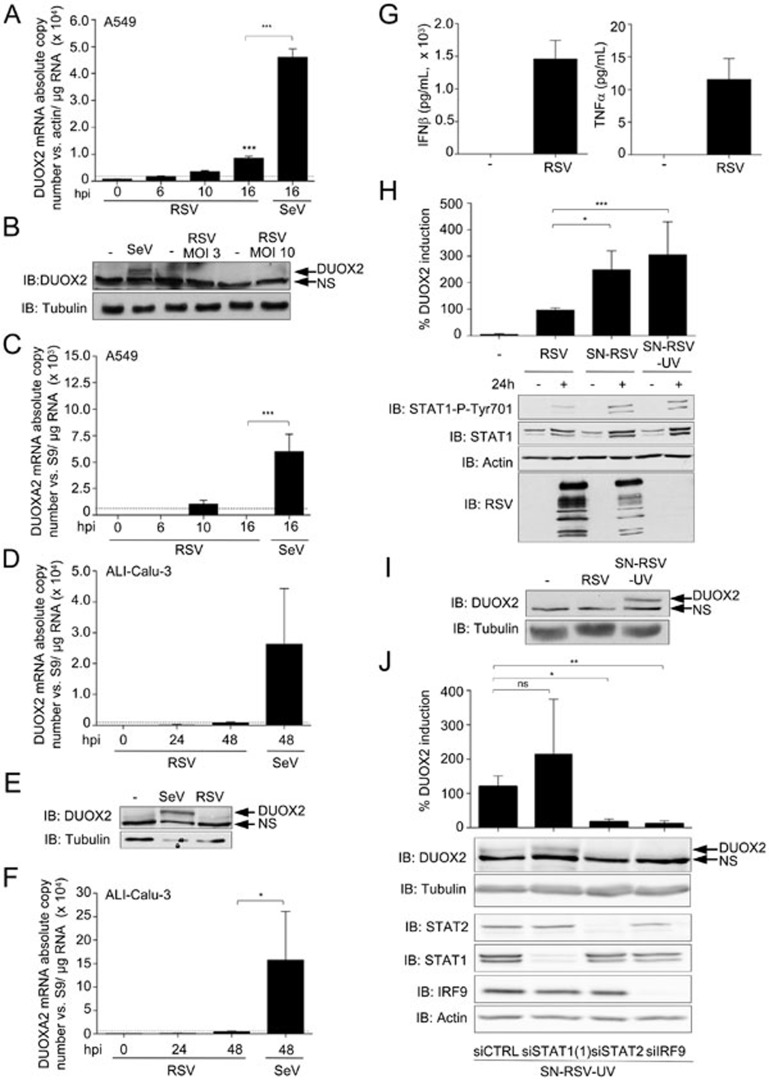
Figure 8.
SN-RSV-UV triggers higher expression of DUOX2 than direct RSV infection. (A, C) A549 cells were infected with RSV at an MOI of 3 for the indicated times. SeV infection (40 HAU/106 cells) was conducted for comparison. (B) A549 cells were infected with RSV at an MOI of 3 or 10 or with SeV at 40 HAU/106 cells for 24 h. (D–F) ALI-Calu-3 cells were infected with RSV at an MOI of 3 for the indicated times, or for 24h in E. (G) A549 cells were infected with RSV at an MOI of 3 for 24 h. IFNβ/TNFα levels in the supernatants were measured by multiplex ELISA. (H, I) A549 cells were stimulated with SN-RSV or UV-treated supernatants (SN-RSV-UV) for 24 h. RSV infection (MOI = 3, 24 h) was conducted for comparison. (J) A549 cells were transfected with siRNAs as in Figure 4A, and 48 h post-transfection, cells were stimulated with SN-RSV-UV for 24 h. In A, C, D, F, H, and J, DUOX2 or DUOXA2 mRNA levels were quantified by qRT-PCR. These values are presented as % DUOX2 induction in H and J. In B, E, H, I and J, immunoblot analyses were performed to analyze the protein expression of DUOX2, STAT1-P-Tyr701, STAT1, RSV, STAT2 or IRF9. All qRT-PCR data are presented as mean ± SD. Data were analyzed by one-way ANOVA with Tukey post-test except in J, where a Dunnett post-test was used; *P < 0.05, **P < 0.01, ***P < 0.001. The pointed line in qRT-PCR quantification data represents the threshold of detection.

