
Fig. 6.—
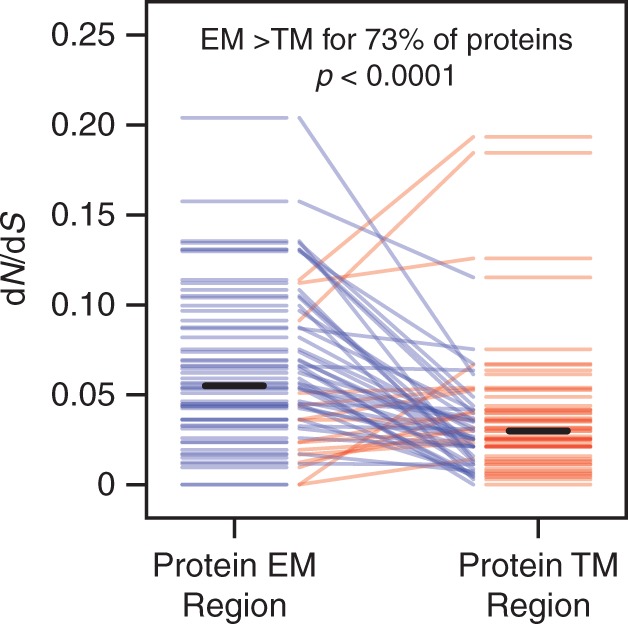
TM residues evolve more slowly than EM residues for most proteins. We divided the 59 yeast membrane proteins in our data set into protein-specific EM and TM regions and calculated dN/dS for any region containing at least 25 residues. EM and TM regions from the same protein are connected by lines, which are colored blue if the EM region has a higher dN/dS value and red if the TM region has a higher dN/dS value. EM regions tend to have higher dN/dS values than TM regions within the same protein. Solid black bars indicate the average dN/dS over all EM or TM protein regions.