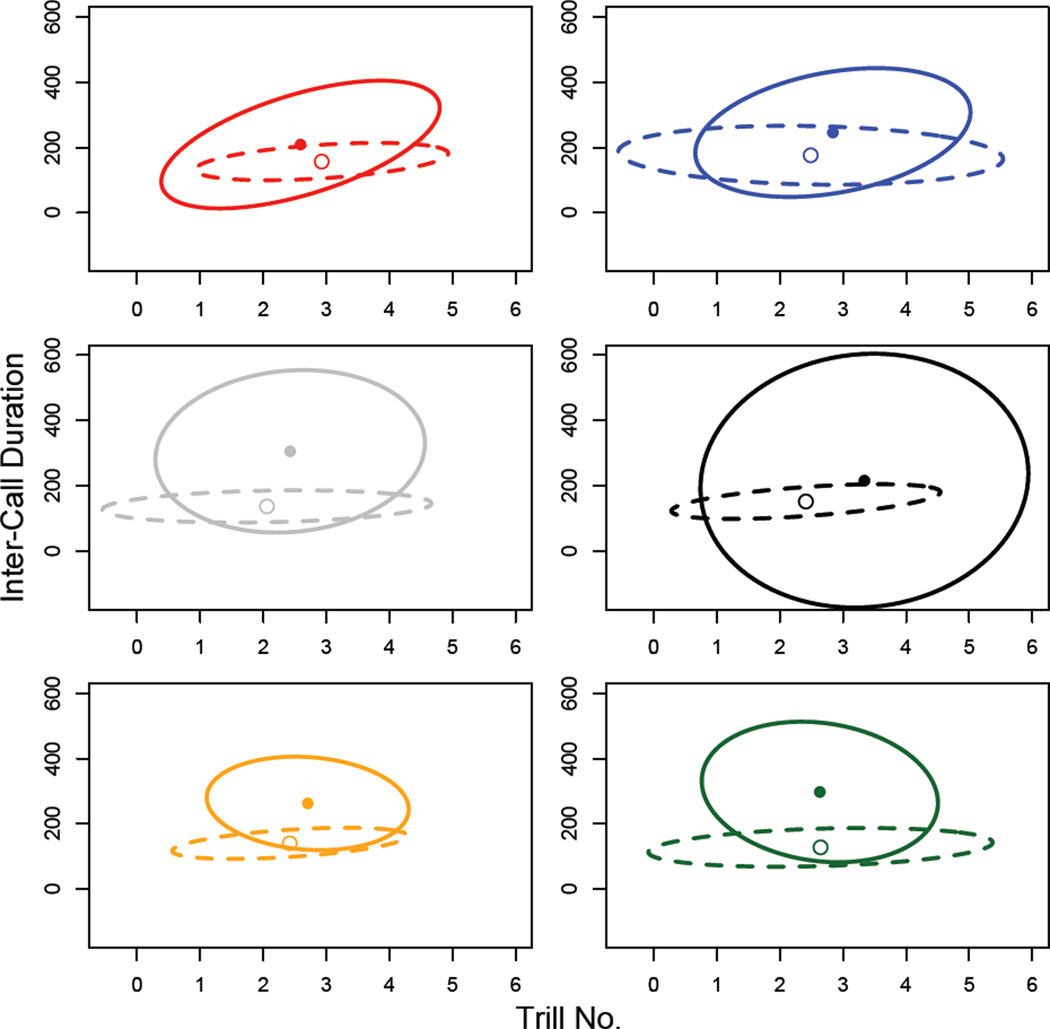
Figure 4.
Ellipses representing the first two dimensions of the call-trait P matrices from experiment 1. The ellipses show the first two principal components projected onto the ICD and TN traits. These traits were chosen for illustration since they had the highest loadings for PC1 and PC2, respectively. The solid point and ellipse represent the call structure of the wild-caught males; the open point and the dashed ellipse represent the call structure of common-garden-reared males. Population colours and abbreviations are as shown for Figure 1.

