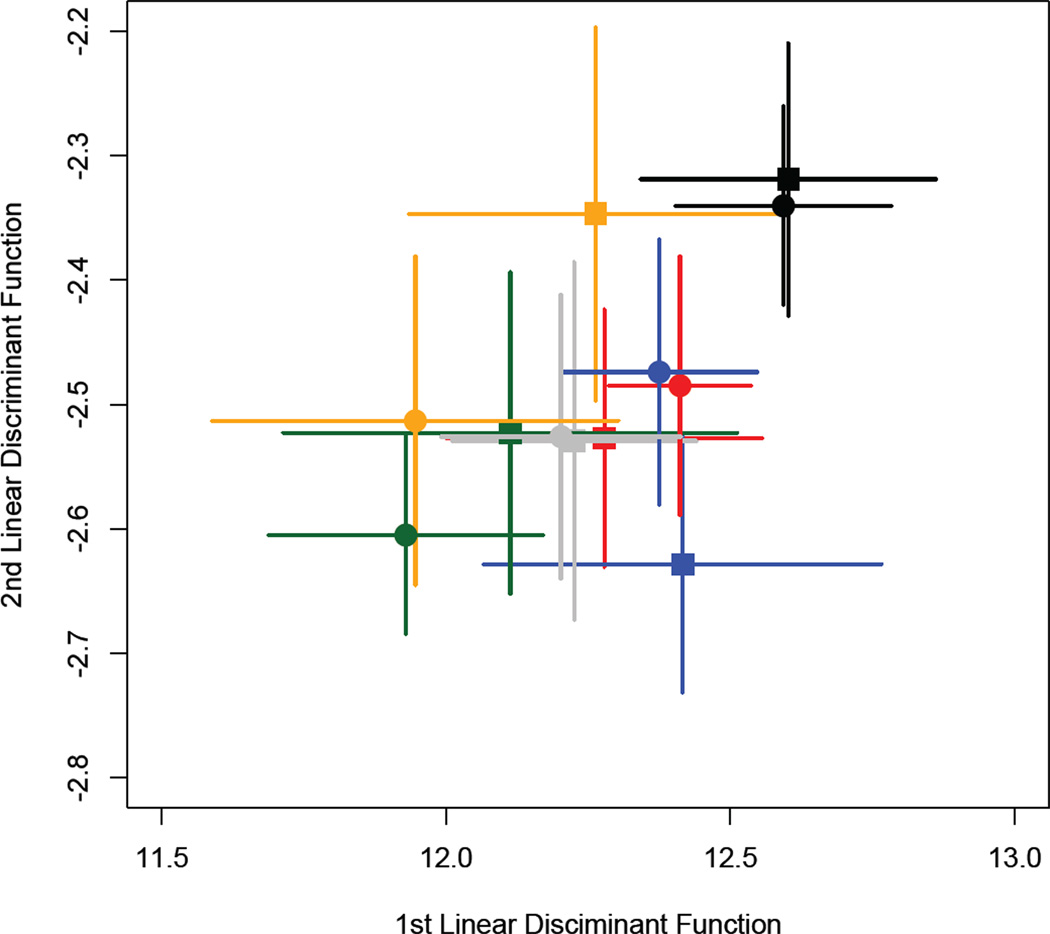
Figure 5.
Variation in call structure among populations and between diet treatments in experiment 2. Population mean linear discriminant scores for the first and second linear discriminant functions were calculated for call structure using population and rearing environment as grouping variables. Populations are colour-coded and abbreviated according to the legend of Figure 1. The round points represent calls measured from males reared on the high-nutrient diet, whereas the square points represent males reared on the low-nutrient diet, and the bars represent the standard error around the mean.

