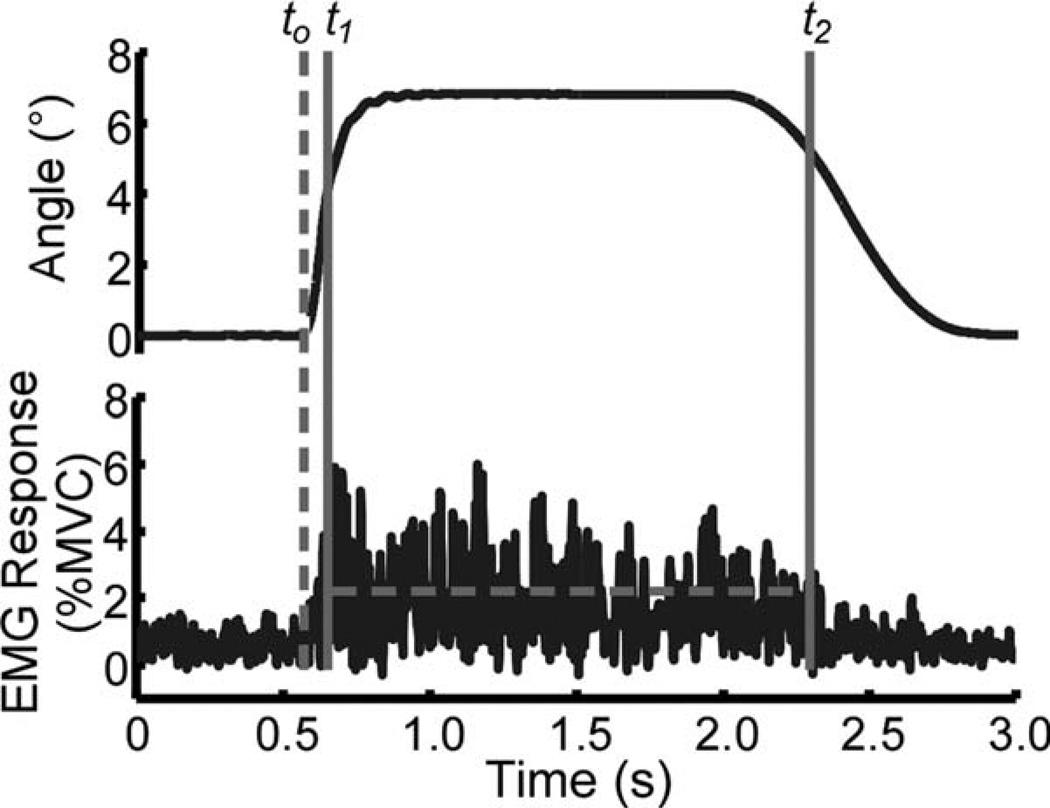
FIGURE 2.
Representative position input (top) and resulting EMG recording (bottom) during a “do not intervene” trial. The dashed vertical line represents the onset of movement, to. Muscle activation onset and offset (t1 and t2) are depicted for the EMG signal. The dashed horizontal line between t1 and t2 represents the intensity of the neuromuscular response.

