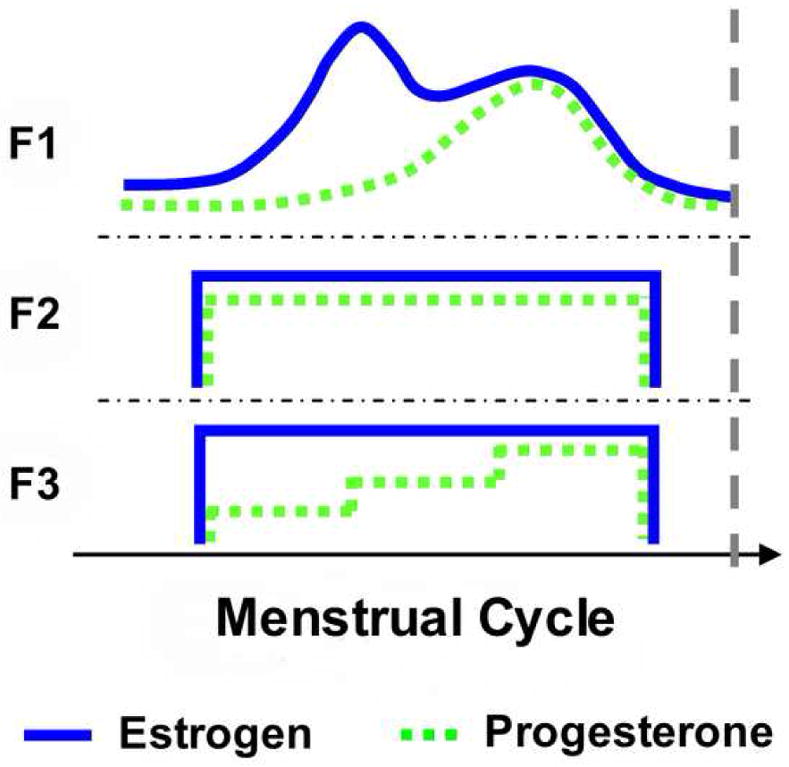
Figure 1.

Schematic of estrogen and progesterone profiles over the course of the menstrual cycle in the three female testing groups: non HC users (F1), monophasic HC users (F2), and triphasic HC users (F3). Profiles for groups F2 and F3 represent synthetic hormone concentrations. The dashed vertical line represents the time point at which all females were tested.
