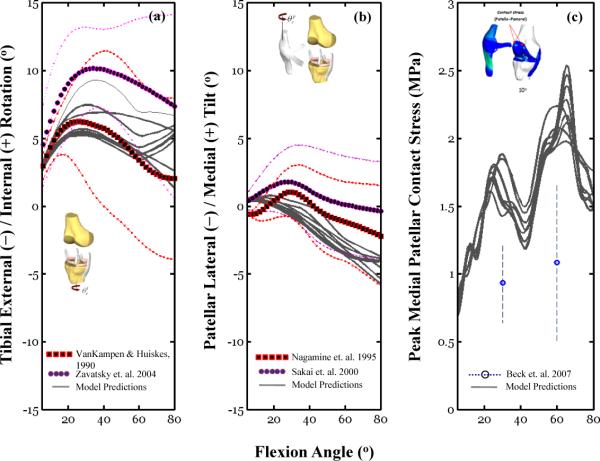
Figure 3.
This figure illustrates the effect of material model variations on simulation outcomes. Finite element simulation results (gray lines) obtained for 10 random set of six material properties (c2) are compared to experimental data collected under similar loading conditions. Table 1 provides an overview of the experimental conditions for the data shown in these figures. Model simulations were obtained using simultaneous quadriceps forces; 56 N for the combined effect of the RF and VI muscles, 20 N for the VM and 38 N for the VL. Figure 3b shows the mean peak contact stress (with standard deviation bars) for the medial patellar facet reported recently by Beck and colleagues (Beck et al., 2007) using a single quadriceps force of 178 N (see Table 1 for experimental description of the Beck et al study).

