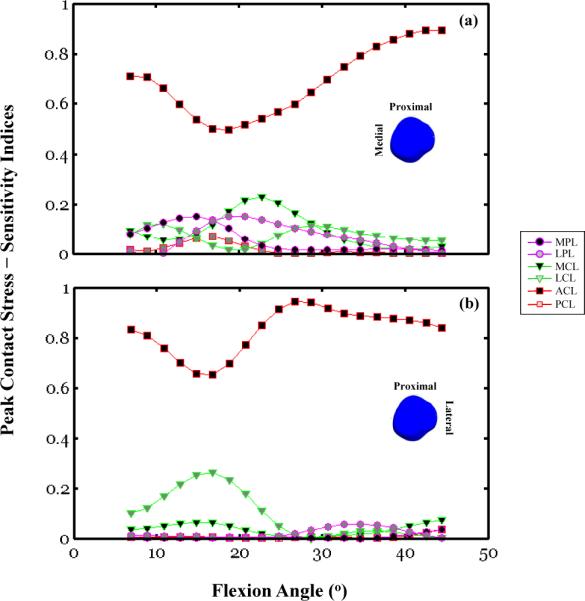
Figure 5.

Sensitivity indices calculated using Equation (4) and plotted as a function of the knee flexion angle for the patellar peak contact stresses:(a) medial facet, (b) lateral facet. The peak contact stress amplitudes and locations are associated with the same simulation outputsfor which Figure 3 shows the response sensitivity curves of the PF DOF. For each subfigure, six traces are shown that correspond to the response sensitivity of a given degree of freedom for each of the six parameter variations, ACL, PCL, MCL, LCL, MPL, and LPL.
