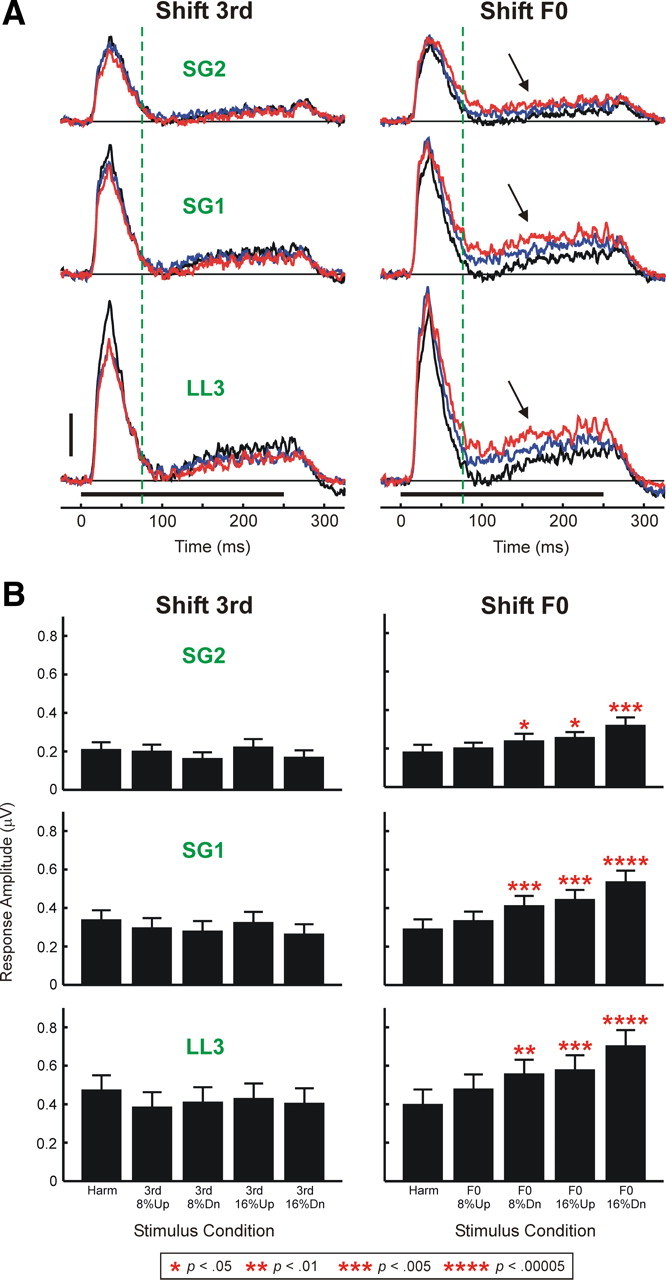
Figure 5.

A, Waveforms of MUA evoked by harmonic and mistuned stimuli averaged across all 46 electrode penetrations into A1. Mean MUA evoked by harmonic stimuli is plotted in black; responses to stimuli mistuned via upward and downward shifts of 16% are plotted in blue and red, respectively (responses to stimuli with 8% shifts are omitted for clarity). Stimulus duration is represented by the black horizontal bar above the time axes. Mean waveforms of MUA evoked under “shift 3rd” and “shift F0” conditions are plotted in the left and right columns, respectively. Mean MUA recorded in LL3 and at more superficial cortical depths (SG1 and SG2) is plotted in separate rows, as indicated. Vertical dashed green lines mark the boundary between “on” and “sustained” portions of responses analyzed in the study. Black arrows indicate enhanced “sustained” responses to mistuned stimuli under the “shift F0” condition. Height of the vertical calibration bar represents 0.5 μV. B, Mean MUA integrated over the “total” response window and averaged across the 46 electrode penetrations. The layout is the same as in A. Error bars represent SEM. Statistically significant (p < 0.05) increases in MUA amplitude under mistuned conditions relative to the harmonic condition are indicated by red asterisks placed above the bars. The p value associated with each of the planned one-tailed paired t tests comparing MUA amplitudes under mistuned and harmonic conditions is represented by the number of asterisks, as identified in the legend at the bottom of the figure. Significant mistuning-related response enhancements are observed only under the “shift F0” condition.
