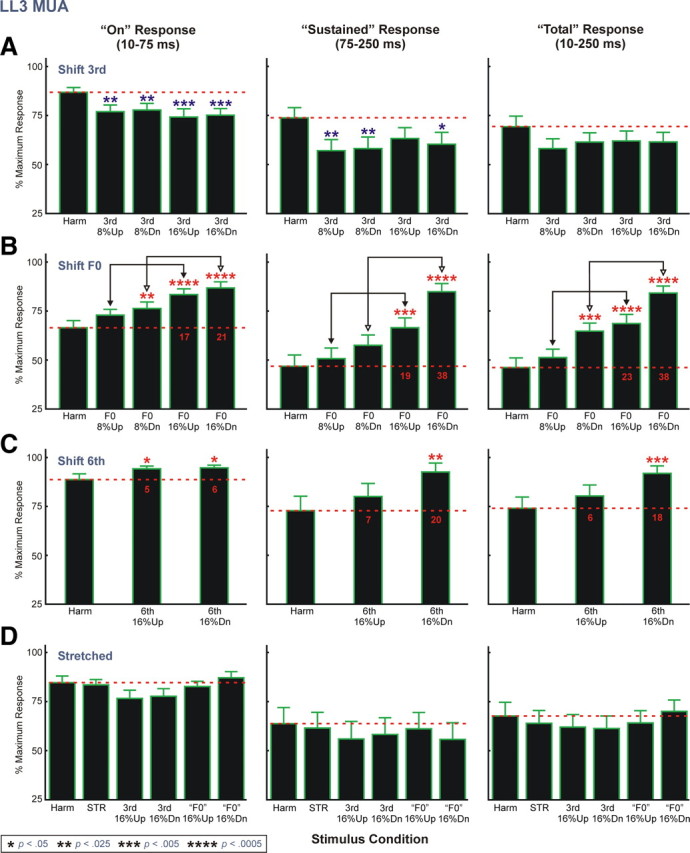
Figure 6.

Normalized LL3 MUA data averaged across electrode penetrations. Mean normalized data for “shift 3rd,” “shift F0,” “shift 6th,” and “stretched” stimulus blocks are represented in A–D, respectively. Number of electrode penetrations contributing to the mean data for “shift 3rd,” “shift F0,” “shift 6th,” and “stretched” stimulus blocks is 46, 46, 22, and 22, respectively. Data for the three response time windows analyzed are represented in separate columns, as indicated. The red horizontal dashed line superimposed on the graphs indicates the mean normalized response amplitude under the harmonic condition. Error bars represent SEM. Statistically significant (p < 0.05) increases and decreases in mean normalized MUA amplitude under mistuned conditions relative to the harmonic condition are indicated by red and blue asterisks, respectively, placed above the bars. The p value associated with each of the planned one-tailed t tests comparing normalized MUA amplitude under mistuned and harmonic conditions is represented by the number of asterisks, as identified in the legend at the bottom of the figure. Additional planned t tests include comparisons (represented by the double arrows) between mean normalized responses under the 8% and 16% mistuning conditions of the “shift F0” stimulus block. For all comparisons, mean normalized responses to 16% mistuned stimuli are significantly larger than those to 8% mistuned stimuli (p < 0.05). Red numbers superimposed on the black bars in B and C indicate the difference in percentage points between mean normalized response amplitudes under mistuned and harmonic conditions.
