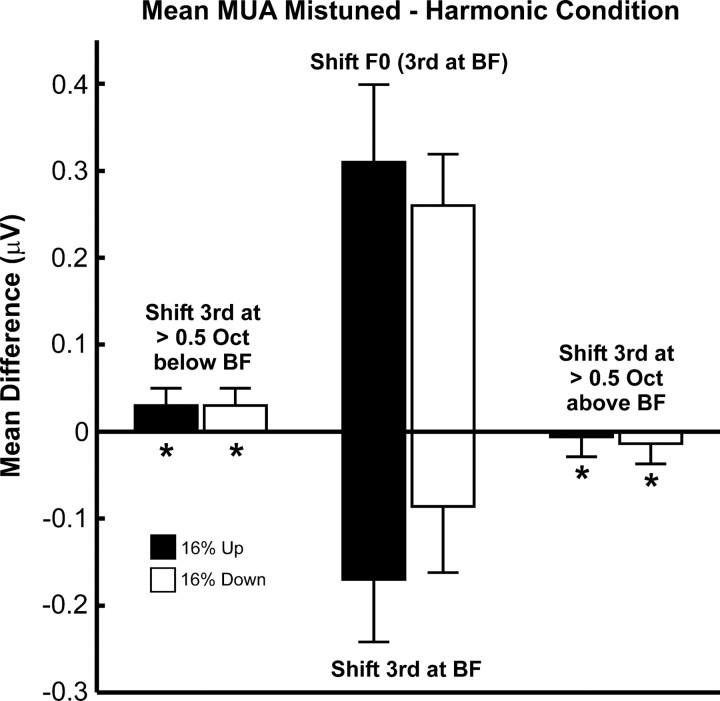
Figure 8.
Mistuning-related response enhancements are maximal when the frequency of the mistuned component is equal to the BF. Mean differences between amplitudes of LL3 MUA (averaged within the “total” response window) evoked by mistuned and harmonic stimuli are significantly diminished when the frequency of the mistuned third harmonic is >0.5 octave above or below the BF (asterisks) compared to when the frequency of the mistuned component is equal to the BF (i.e., under the “shift F0” condition; bars in center of the figure above zero amplitude). Bars in center of the figure below zero amplitude represent mean data under the “shift 3rd” condition. Data for upward and downward shifts of stimulus components are represented by black and white bars, respectively. Error bars represent SEM. See Results for details.

