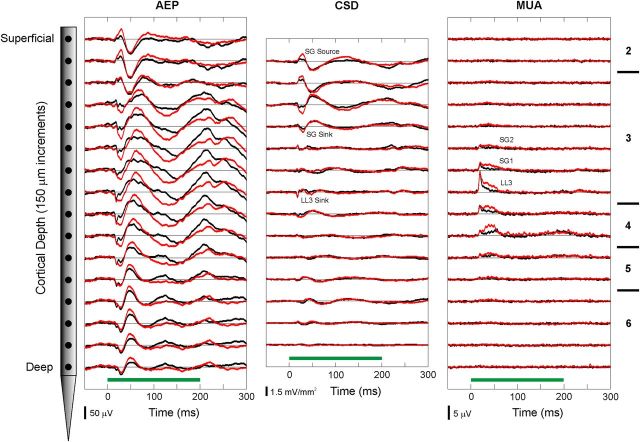
Figure 3.
Representative example of laminar response profiles elicited in A1 by standard and deviant tones in the oddball paradigm. Responses to the BF tone (950 Hz) when presented as a standard and as a deviant are plotted in black and red, respectively. Frequency of the non-BF tone was 600 Hz (ΔF = 37%). AEPs (left column) and MUA (right column) are recorded by a multicontact electrode, which samples activity at 16 laminar depths simultaneously (left; intercontact spacing: 150 μm). Approximate laminar boundaries are indicated on the right of the figure. One-dimensional CSD profiles (center column) are derived from the AEP profiles. Duration of stimuli (200 ms) is represented by the green horizontal bars above the time axes. CSD response components examined in the study are labeled. AEPs were analyzed at corresponding depths. Analysis of MUA focused on activity within LL3 and at two adjacent supragranular locations (SG1 and SG2).

