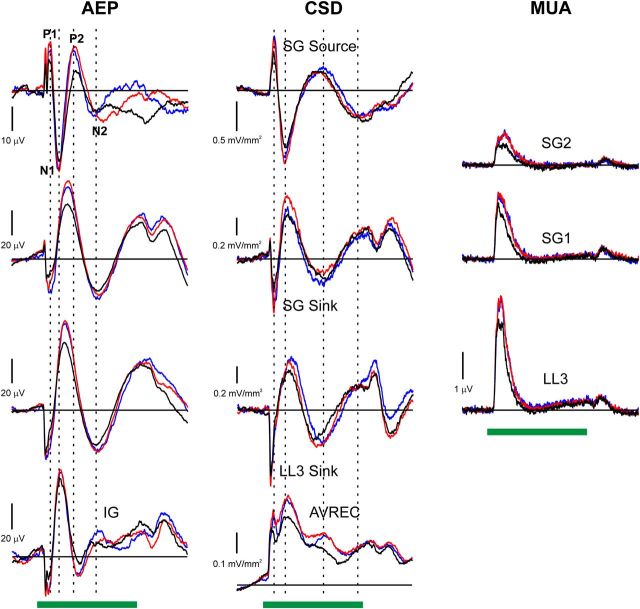
Figure 4.
Average AEP (left column), CSD (center column), and MUA (right column) elicited in A1 by BF tones in the oddball and many standards control conditions (n = 30 electrode penetrations). Stimulus duration (200 ms) is represented by the horizontal green bars. Responses to the BF tone when it was presented as a standard and as a deviant in the oddball condition are plotted in black and red, respectively. Responses to the BF tone under the control condition are plotted in blue. Mean AEP and CSD waveforms at laminar depths corresponding to the LL3 sink, SG sink, and SG source are plotted in separate rows, as indicated. The mean AEP recorded 600 μm below the LL3 sink in IG is also included. The AVREC, quantifying total net extracellular current flow, is shown in the plot at the bottom of the center column. The MUA recorded in lower lamina 3 and in two adjacent supragranular channels are labeled LL3, SG1, and SG2, respectively. Major deflections in the superficial AEP are labeled (P1, N1, P2, and N2), and their peak latencies marked by dashed vertical lines superimposed on the waveforms. Peak latencies of major CSD components in the corresponding superficial CSD channel are also indicated by dashed vertical lines. Note different amplitudes of responses recorded at different depths, as indicated by the vertical calibration bars.

