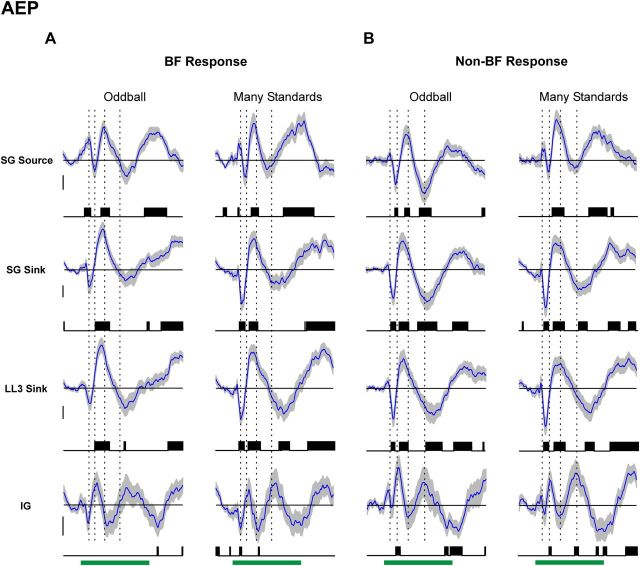
Figure 5.
Average AEP difference waveforms under the oddball and many standards control conditions. Average difference waveforms for AEPs elicited by BF and non-BF tones are shown in A and B, respectively (mean: blue curve; ±SEM: gray shading above and below mean). Difference waveforms under the oddball condition (left column of A and B) are obtained by subtracting AEPs elicited by standards from AEPs elicited by deviants. Difference waveforms under the many standards control condition (right column of A and B) are obtained by subtracting AEPs elicited by standards in the oddball condition from AEPs elicited by the same tones in the many standards control condition. Difference waveforms computed at different laminar depths are plotted in separate rows, as indicated. Time points displaying statistically significant differences (p < 0.01, uncorrected) are indicated by the black vertical lines beneath the waveforms. To indicate the temporal relationship between difference waveform components and obligatory components of the AEP, peak latencies of major deflections in the mean superficial AEP elicited by the same tones under the many standards control condition are indicated by the dashed vertical lines superimposed on the waveforms. Calibration: 5 μV.

