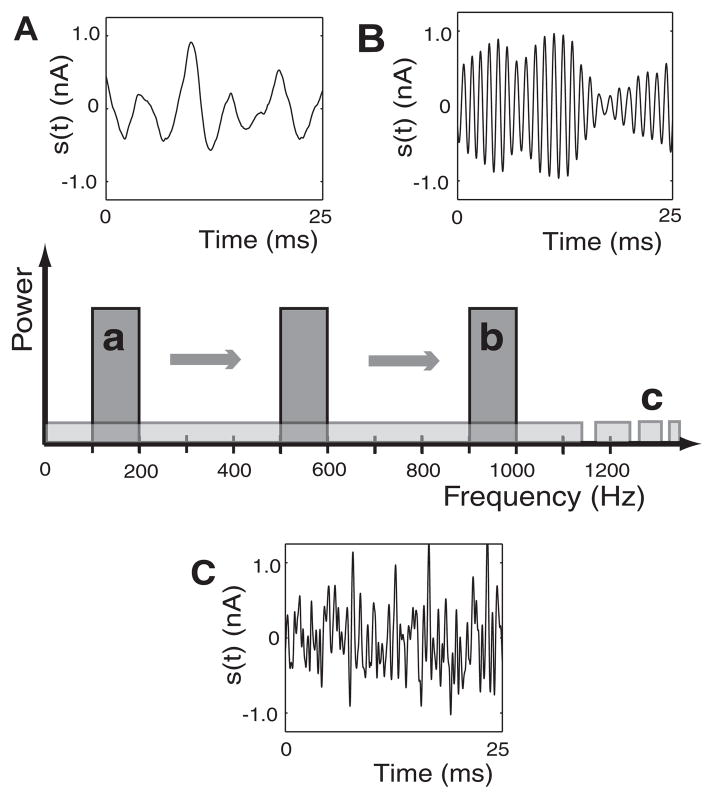
FIG. 1.
Current stimuli. Center: power spectra of the current stimuli used in the study. Narrowband stimuli were 100 Hz wide with center frequency varied along the frequency axis. The broadband stimulus had a cutoff frequency off the axis at 2 kHz. Sample time courses are shown for 2 narrowband stimuli with center frequencies of 150 Hz (A) and 950 Hz (B), respectively. C: sample time course of the broadband stimulus.

